Despite strong fundamentals, the Shiba Inu (SHIB) price is currently struggling to leave bearish territory. Since the local high of around $0.000016 on February 4, all attempts to generate new upward momentum have failed. Now SHIB may be facing a turning point.
Fundamentals Support The Shiba Inu Bulls
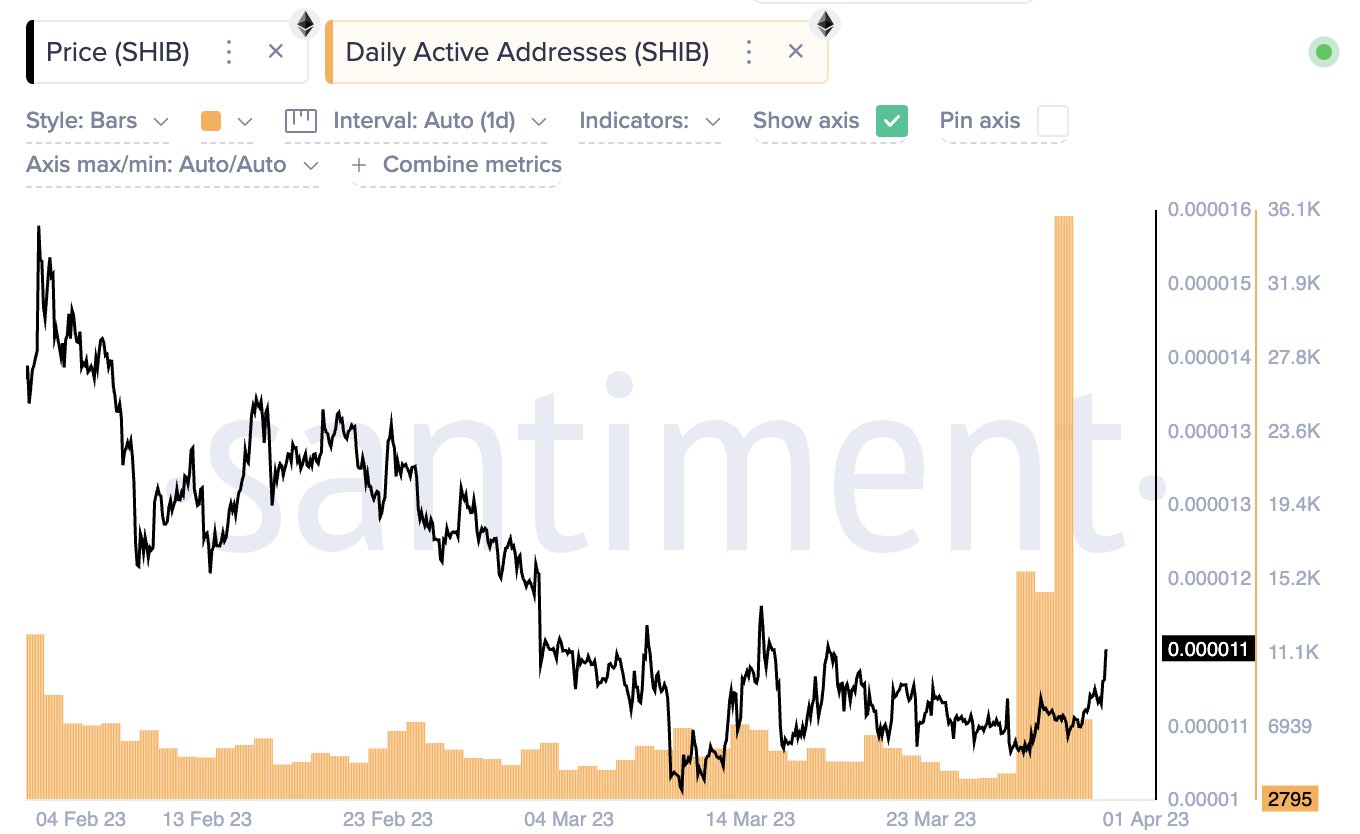
At least the underlying fundamentals provide some hope for the Shiba Inu bulls. As analyst Ali Martinez pointed out via Twitter, Shiba Inu recorded its largest increase in daily active addresses in a year at the end of March.

In one day, 35,788 unique SHIB addresses interacted with the network. Generally, network activity is seen as a bullish metric that precedes price increases.
Also showing a favorable bias are the SHIB burns. As reported by Shibburn, 6.78 billion SHIB tokens were burned with 540 transactions in the entire month of March. Both the absolute number of SHIB destroyed and the transaction count thus show a significant increase compared to the previous month of February.
In that month, only 352.21 million SHIB were burned in 128 separate transactions through community burn initiatives. Overall, the March burn is the highest since October 2022.
🔥🔥🔥 6,782,788,547 $SHIB tokens have been burned in the month of March with 540 transactions. #shib
— Shibburn (@shibburn) April 1, 2023
In January 2023, 1.12 billion were burned in 223 transactions; in December 2022, 2.072 billion SHIB (in 349 transactions); in November 1.922 billion SHIB (in 381 transactions); and in October, 9.05 billion SHIB (in 2,433 transactions).
SHIB Price At Turning Point
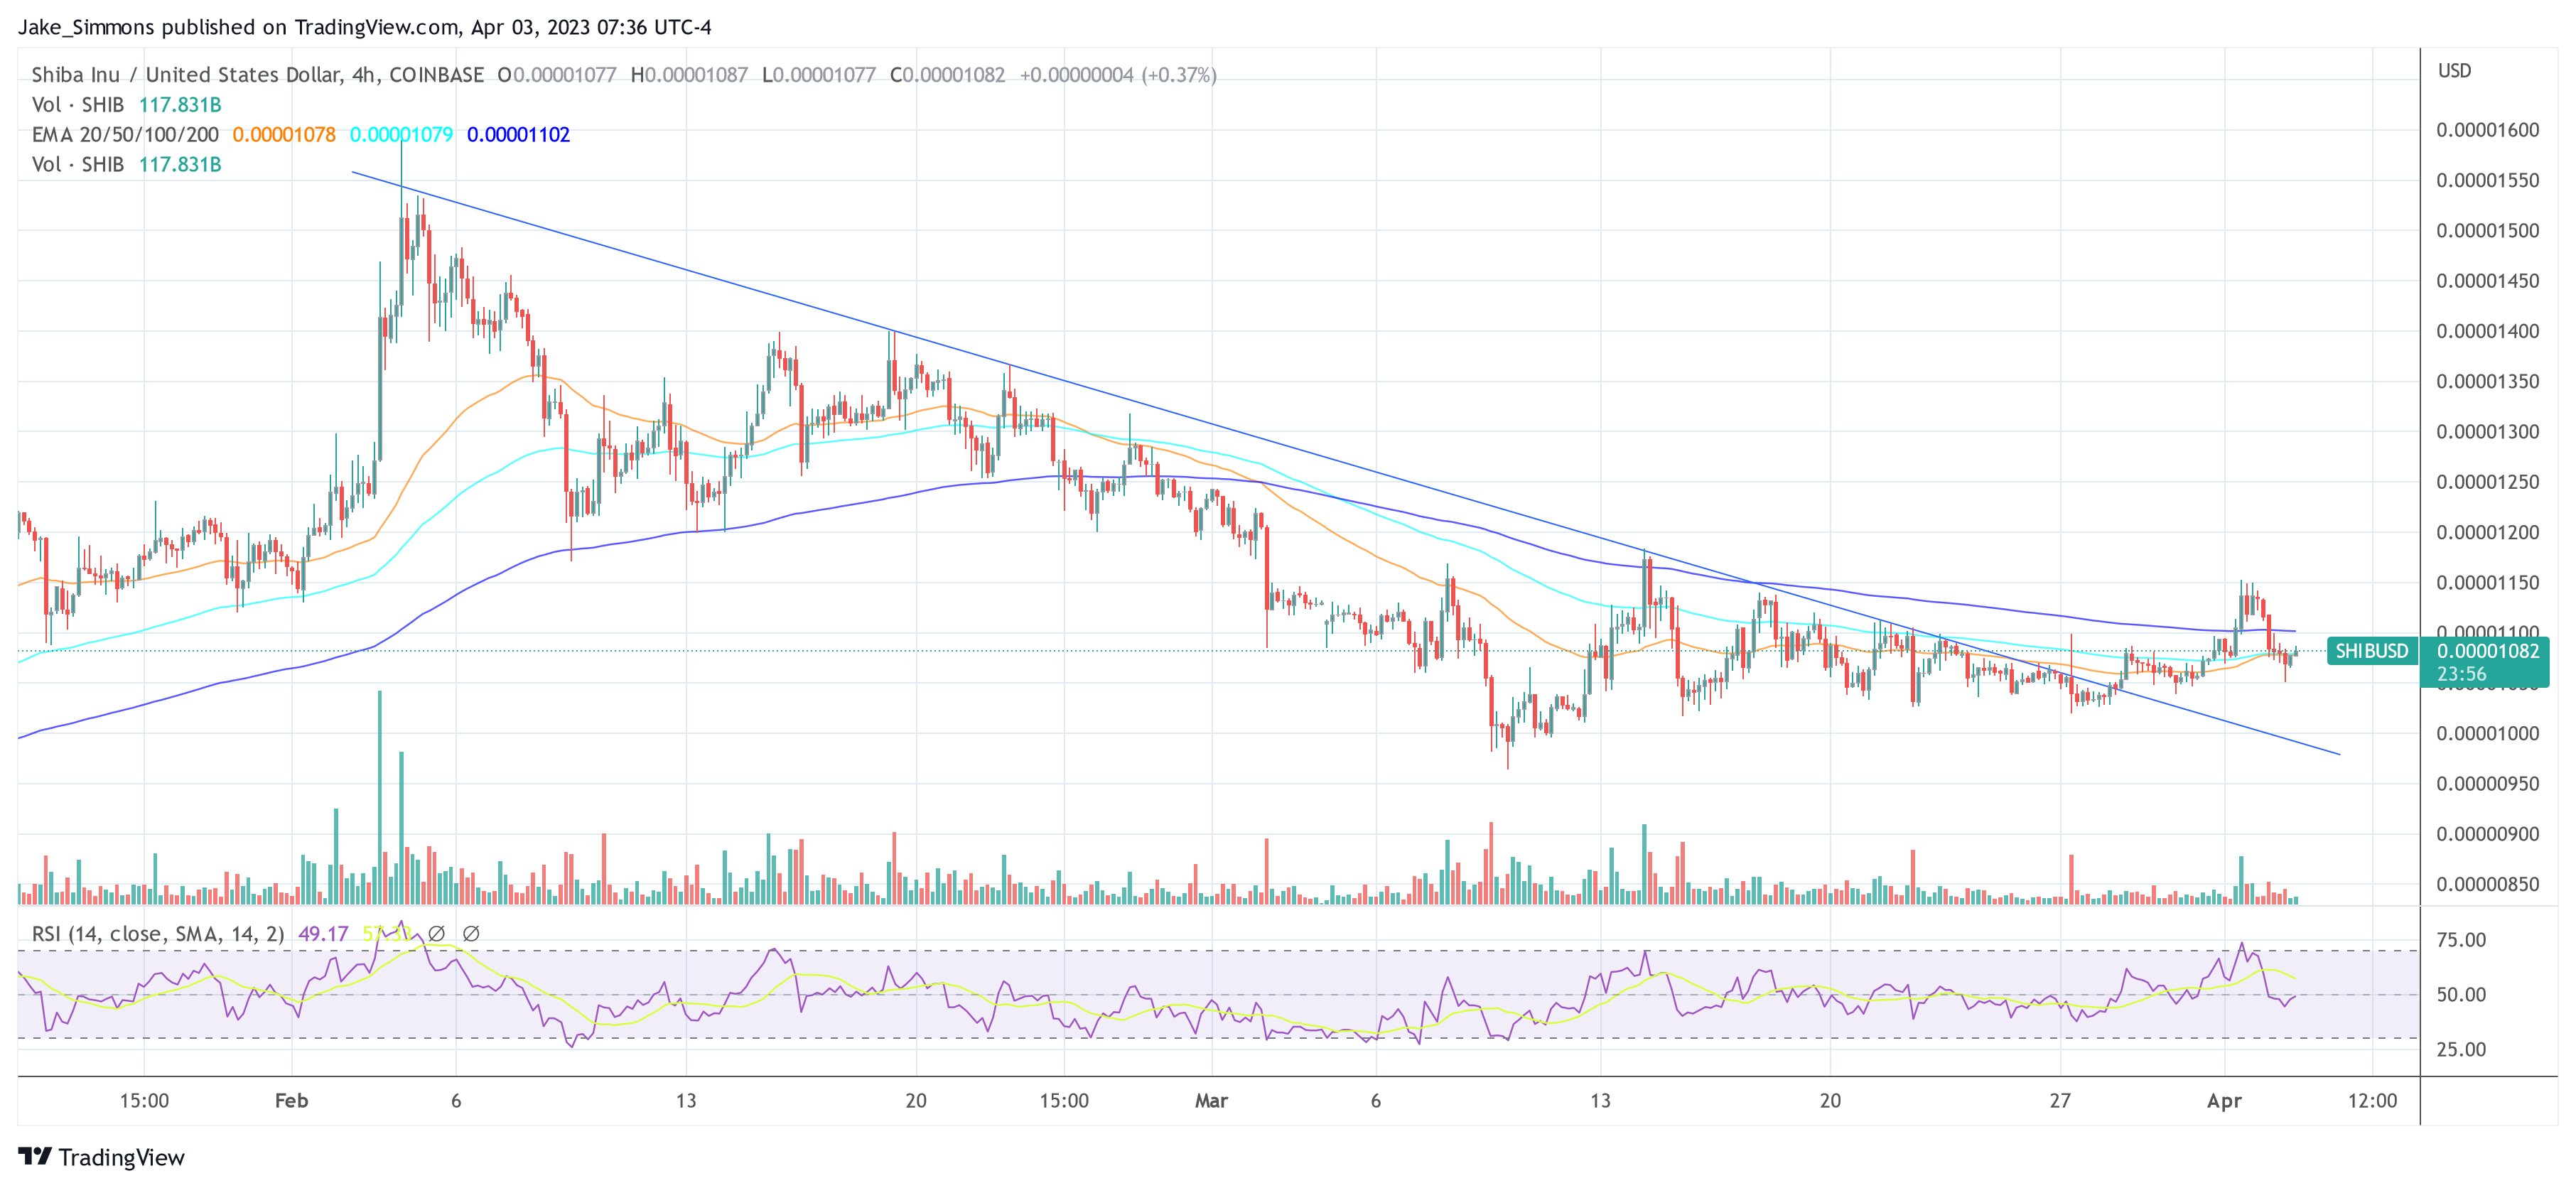
A look at the 4-hour chart of SHIB shows that in the last week of March, the price was able to break a downward trend that had persisted since the beginning of February. However, the subsequent upward movement is not very convincing.
Despite the earlier breakout, the Shiba Inu price is struggling to maintain its upward trajectory. In fact, the SHIB price has failed to break the series of lower lows. The April 1 high at $0.00001152 was lower than the March 14 local high.
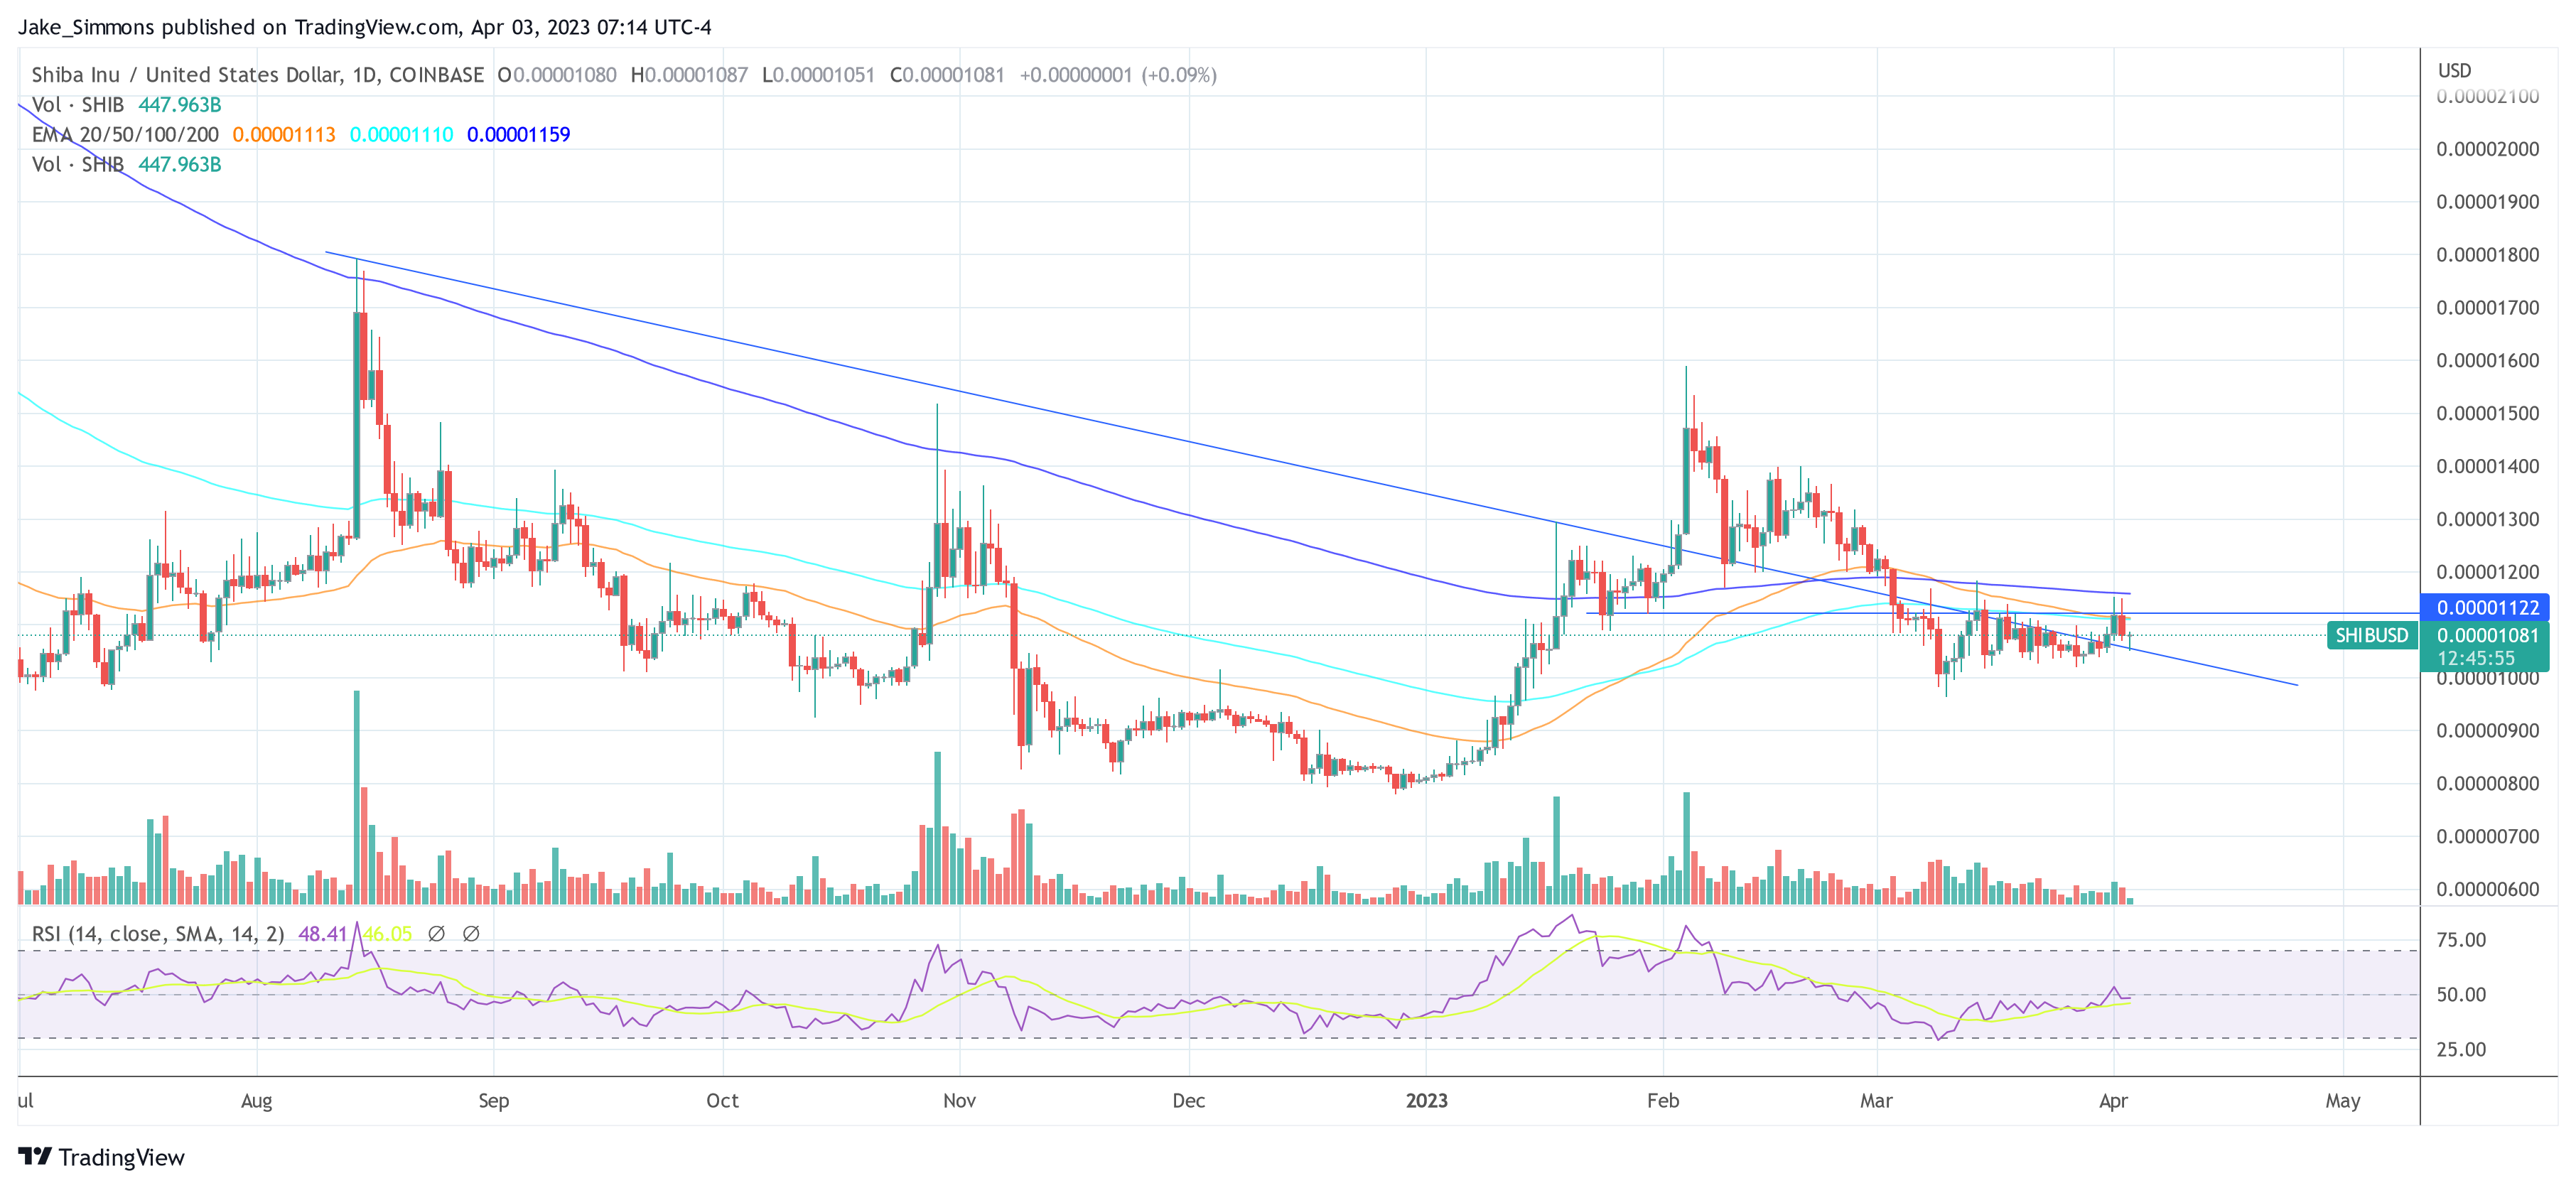
The 1-day chart of SHIB reveals a similar pattern. At the beginning of February 2023, SHIB managed to break out of a downward trend that had lasted since August 2022. However, the price couldn’t maintain its trajectory and fell back below the trend line a few weeks later.
The breakout seen in recent days also looks rather weak. SHIB bounced off the key resistance at $0.00001122 and is retesting the trendline today.
For SHIB bulls, it is of utmost importance to defend this trend breakout. Otherwise, a retest of the local low at $0.0000965 from March 10 could be imminent.
Source: Read Full Article