Quant(QNT) price is struggling to hold above the moving average lines after the recent drop above the $136 low.
Quant long-term price forecast: bullish
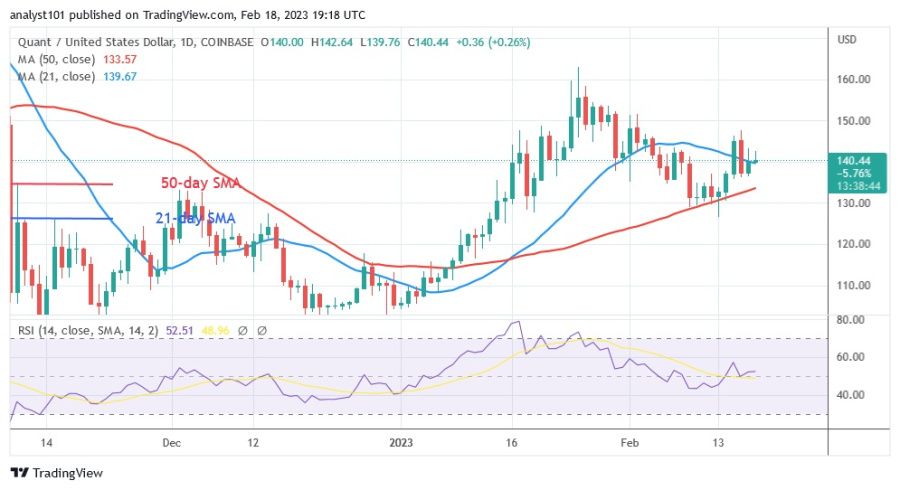
Since January 25, the previous bounce has ended. On January 25, buyers failed to maintain positive momentum above $160 resistance. As a result, the altcoin fell to a low of $130. QNT is currently in an upward correction; however, the initial resistance for the upward movement is above $140 or the 21-day line SMA. If the price clears the initial obstacle at $140, Quant will resume its uptrend. On the other hand, the downtrend will resume if the altcoin is rejected and falls below the 50-day line SMA. The altcoin will fall to a low of $105.00.
Quant price indicator analysis

At level 52 of the Relative Strength Index for the period 14, the altcoin is trading in the uptrend zone. In the bullish trend zone, the altcoin can go even higher. The Altcoin is in a positive momentum above the daily Stochastic threshold of 30.
Technical indicators
Key supply zones: $140, $150, $160
Important demand zones: $120, $110, $100
What is the next move for Quant?
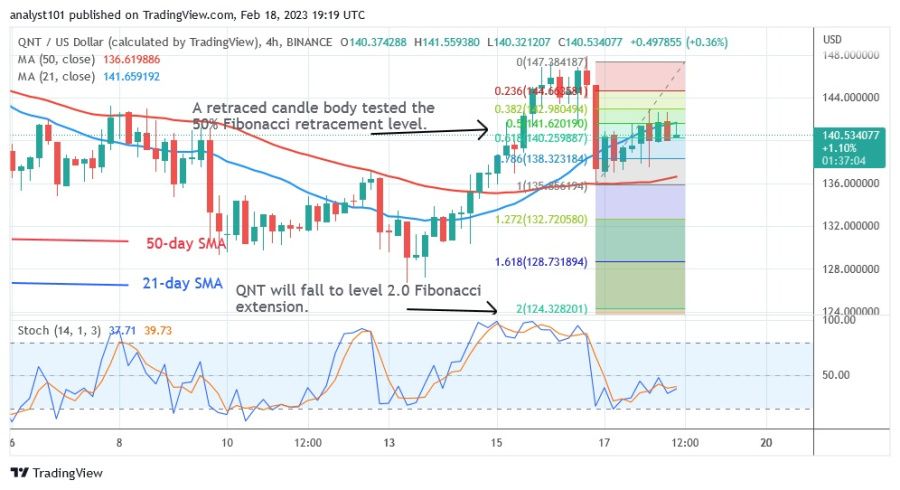
Quant is in a downtrend and its price range is between $130 and $140. If this range is broken, the crypto asset will develop a trend. After a downward correction in QNT on February 26, a retreating candlestick tested the 50% Fibonacci retracement level. After the correction, QNT will fall to the 2.0 Fibonacci extension level or $128.73.
Disclaimer. This analysis and forecast are the personal opinions of the author and are not a recommendation to buy or sell cryptocurrency and should not be viewed as an endorsement by CoinIdol. Readers should do their own research before investing in funds.
Source: Read Full Article