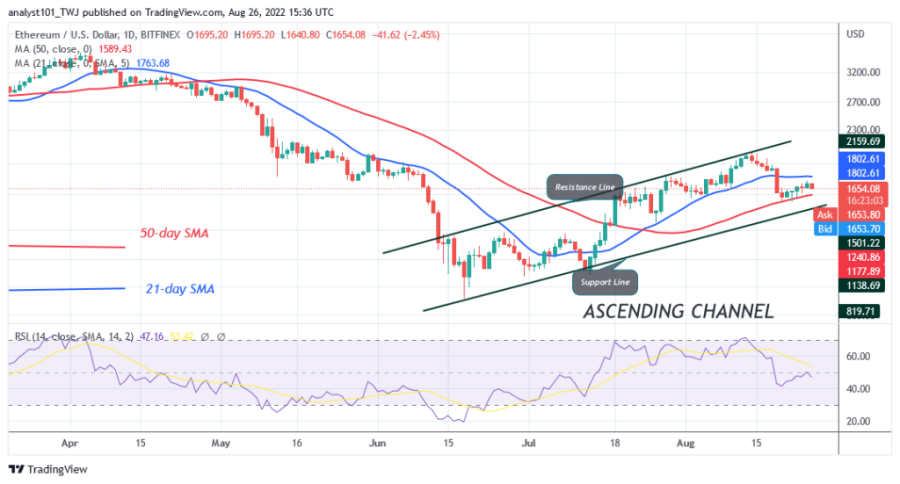
Ethereum (ETH) is in a downtrend and has recovered 50% as it trades between moving average lines. In short, the largest altcoin crashed and found support above the 50-day line SMA after the price collapse.
The downtrend will continue if Ether loses the 50-day line SMA or the $1,500 support. Secondly, Ether will rise again if the altcoin recovers and breaks out above the 21-day line SMA resistance.

In the meantime, none of the moving average lines have been broken as the altcoin continues to move within its trading range. On the upside, a break above the 20-day line SMA will push the altcoin to retest resistance at $2,030. On the other hand, if the bears break the 50-day line SMA or the $1,500 support, Ether will fall to the lows of either $1,280 or $1,029.90.
Ethereum indicator analysis
Ether is at level 47 of the Relative Strength Index for period 14. The coin is in the downtrend zone despite the upward correction. Currently, the price bars of Ether are between the moving average lines, which indicates further fluctuating movement of the cryptocurrency. The altcoin is above the 60% area of the daily stochastic. The altcoin is in a bullish momentum.
Technical indicators
Key Resistance Zones: $2,500, $3,300, $4,000
Key Support Zones: $2,000, $1,500, $1,000
What is the next direction for ethereum?
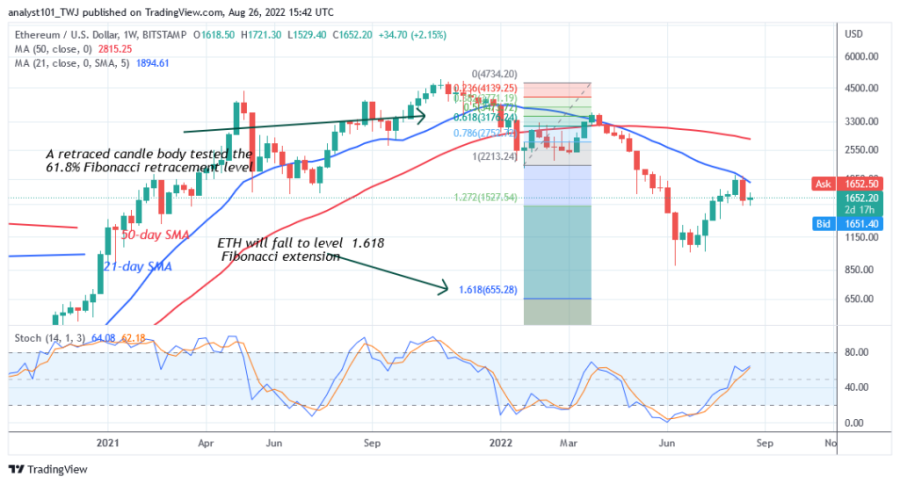
Ethereum is trading between moving average lines as it makes an upward correction. On the weekly chart, a retraced candlestick tested the 61.8% Fibonacci retracement level on March 28. The retracement suggests that ETH will fall to the Fibonacci extension level of $1.618 or $655.28.
Disclaimer. This analysis and forecast are the personal opinions of the author and are not a recommendation to buy or sell cryptocurrency and should not be viewed as an endorsement by CoinIdol. Readers should do their research before investing in funds.
Source: Read Full Article