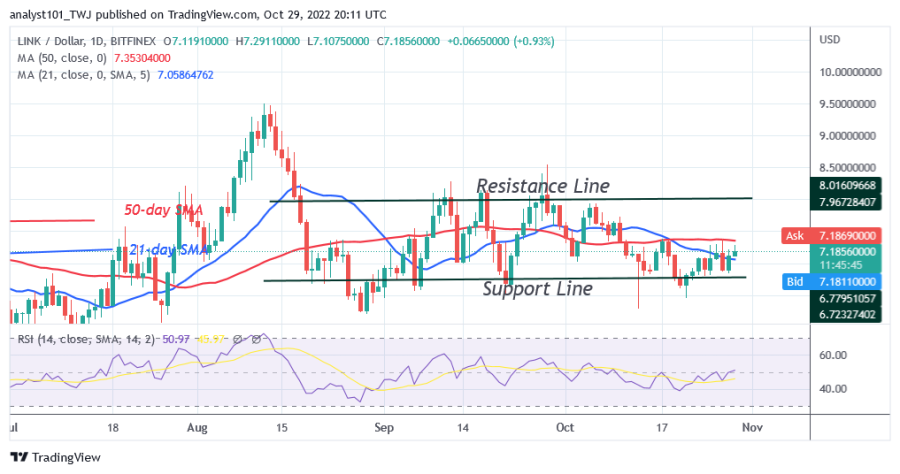
The price of Chainlink (LINK) is in an upward correction after crossing the 21-day line SMA. The cryptocurrency is moving above the 21-day line but below the 50-day moving average.
Buyers broke through the 21-day line SMA, which served as resistance. Bullish momentum will extend to the 50-day line SMA. A break above it will enable the altcoin to retest the overriding resistance at $8.00. On the other hand, if buyers fail to break the 50-day line SMA, the altcoin will be forced to move between the average lines. Chainlink is trading at $7.11 at the time of writing.
Chainlink indicator reading

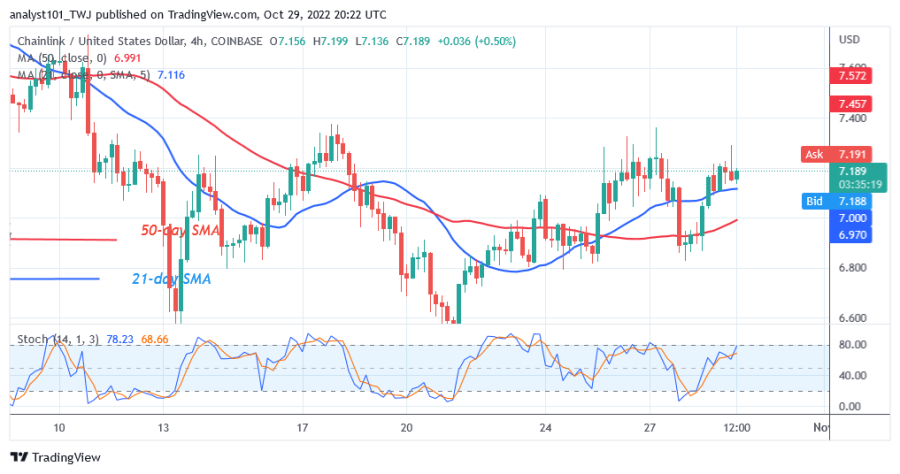
For the period 14, Chainlink is at level 49 on the Relative Strength Index. This means that supply and demand have reached equilibrium. LINK is in bearish momentum below the 80% area of the daily stochastic. Price bars are located between the moving average lines, which indicates that the cryptocurrency is moving in a certain range. The moving average lines are still horizontally flat, indicating a sideways movement.
Technical indicators:
Major Resistance Levels – $30 and $35
Major Support Levels – $10 and $5
What is the next move for Chainlink?
Chainlink is in a sideways movement as it is contained between the price levels of $6.60 and $8.00. The upward correction threatens to fail at the 50-day line SMA. In the meantime, the cryptocurrency price is fluctuating between the moving average lines.
Disclaimer. This analysis and forecast are the personal opinions of the author and are not a recommendation to buy or sell cryptocurrency and should not be viewed as an endorsement by Coin Idol. Readers should do their own research before investing funds.
Source: Read Full Article