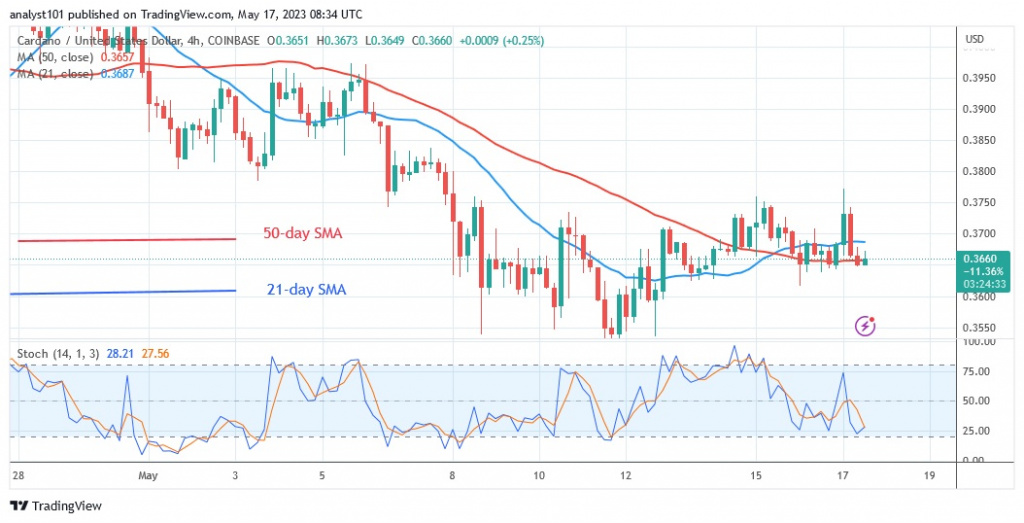
Cardano (ADA) is sliding below the moving average lines at the moment.
Cardano price long-term forecasts: bearish
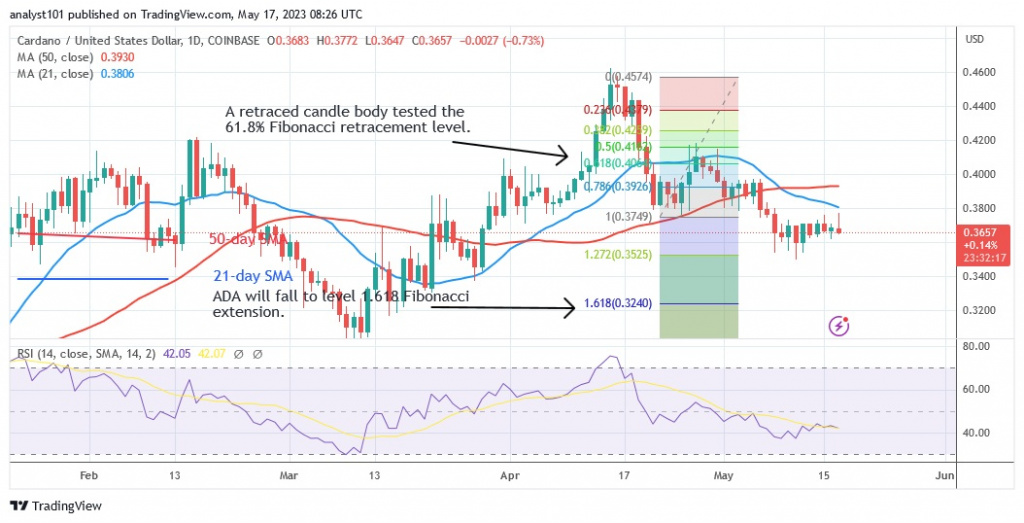
Since the recent downward impulse on May 8, the cryptocurrency asset has been in a range where it is above the current support. The altcoin dropped to a low of $0.35 before fluctuating back above that point.

Cardano is currently selling for $0.36 at this point. On a positive note, the 21-day line SMA has halted the upward movement. Current support has held to the downside over the past week. However, the price indication continues to suggest that Cardano will continue to lose ground until it reaches its previous low. If the current support is reached, ADA will fall to the 1.618 Fibonacci extension level or $0.32.
Cardano indicator analysis
On the Relative Strength Index for the 14 period, Cardano is at the 43 level. After an upward correction, ADA is in the bearish trend zone. The cryptocurrency could continue to fall. The moving average lines are below the price bars, causing the altcoin to decline. Above the daily stochastic threshold of 25, Cardano is in a positive momentum. The rejection has stopped the pace of the positive trend.
Technical indicators
Key resistance zones: $1.00, $1.20, $1.40
Key support zones: $0.60, $0.40, $0.20
What is the next move for Cardano?
Cardano held above the $0.35 support last week. The altcoin managed to stay above the current support level thanks to the presence of Doji candlesticks. It seems that Cardano will start to fall as soon as it loses its current support.
Disclaimer. This analysis and forecast are the personal opinions of the author and are not a recommendation to buy or sell cryptocurrency and should not be viewed as an endorsement by CoinIdol. Readers should do their own research before investing in funds.
Source: Read Full Article