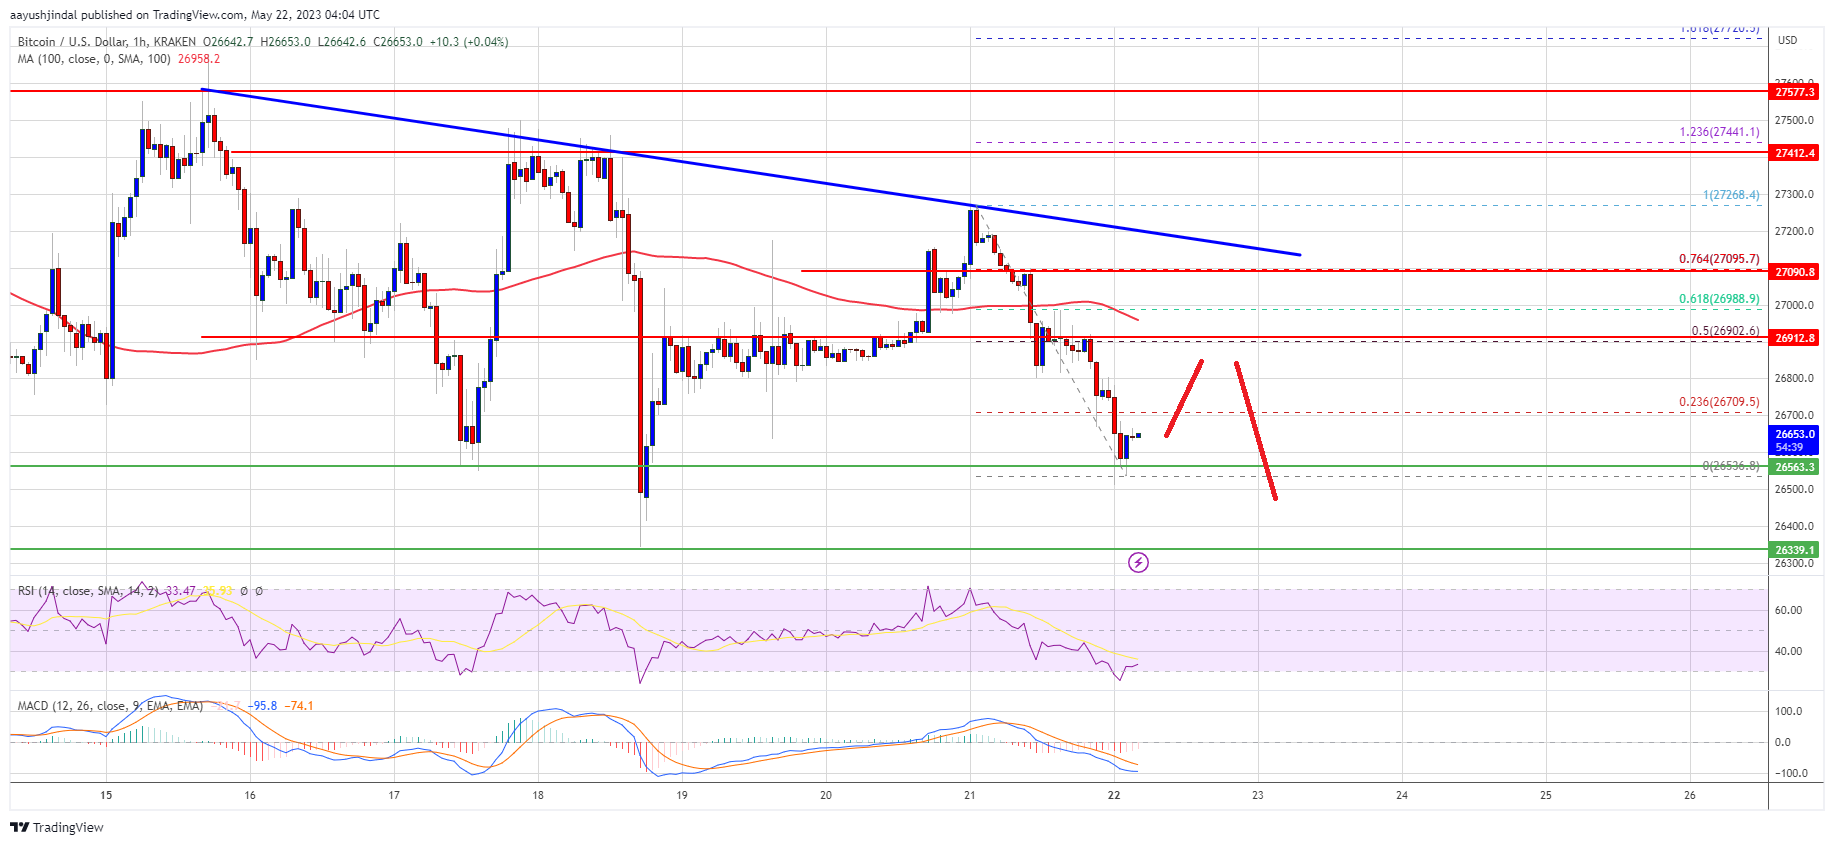
Bitcoin price is holding the key $26,550 support zone. BTC could start a major decline if there is a close below $26,550 and $26,400.
- Bitcoin started another decline and traded below the $26,850 level.
- The price is trading below $27,000 and the 100 hourly Simple moving average.
- There is a major bearish trend line forming with resistance near $27,120 on the hourly chart of the BTC/USD pair (data feed from Kraken).
- The pair could gain bearish momentum if there is a daily close below $26,550.
Bitcoin Price Remains In A Range
Bitcoin price started a fresh decline below the $27,000 level. BTC traded below the $26,800 support zone and trimmed most of its gains. However, the bulls were active near the $26,550 support.

A low is formed near $26,536 and the price is now consolidating losses. It is clearly showing bearish signs below $27,000 and the 100 hourly Simple moving average. There is also a major bearish trend line forming with resistance near $27,120 on the hourly chart of the BTC/USD pair.
Bitcoin price is now facing resistance near the $26,720 level. It is close to the 23.6% Fib retracement level of the recent decline from the $27,268 swing high to the $26,536 low.
The next major resistance is near the $27,000 level and the 100 hourly Simple moving average. It is close to the 61.8% Fib retracement level of the recent decline from the $27,268 swing high to the $26,536 low. The first major resistance is near the trend line.
Source: BTCUSD on TradingView.com
A close above the $27,120 resistance might reduce selling pressure. The next key resistance is near $27,550, above which the price might start a decent increase toward the $28,000 resistance. Any more gains might send the price toward the $28,500 level.
More Losses in BTC?
If Bitcoin’s price fails to clear the $27,120 resistance, it could continue to move down. Immediate support on the downside is near the $26,550 level.
The next major support is near the $26,350 zone, below which the price might gain bearish momentum. In the stated case, it could test the $25,800 level. Any more losses might take Bitcoin toward the $25,500 level in the near term.
Technical indicators:
Hourly MACD – The MACD is now gaining pace in the bearish zone.
Hourly RSI (Relative Strength Index) – The RSI for BTC/USD is now below the 50 level.
Major Support Levels – $26,550, followed by $26,350.
Major Resistance Levels – $27,000, $27,120, and $27,500.
Source: Read Full Article