Bitcoin price started a downside correction from the $28,500 resistance zone. BTC found support near $26,600 and is currently attempting a fresh increase.
- Bitcoin is moving higher above the $27,000 resistance.
- The price is trading below $27,800 and the 100 hourly simple moving average.
- There was a break below a key bullish trend line with support near $27,900 on the hourly chart of the BTC/USD pair (data feed from Kraken).
- The pair could rally again if there is a clear move above the $28,000 resistance zone.
Bitcoin Price Eyes Fresh Increase
Bitcoin price failed to clear the $28,500 resistance zone and reacted to the downside. The fed increased rates from 4.75% to 5%, which resulted in a bearish reaction. BTC declined below the $27,500 support zone.

Besides, there was a break below a key bullish trend line with support near $27,900 on the hourly chart of the BTC/USD pair. The pair even traded below the $27,000 level. A low is formed near $26,623 and the price is now correcting losses.
Bitcoin price climbed above the 23.6% Fib retracement level of the downward move from the $28,879 swing high to $26,623 low. It is still trading below $27,800 and the 100 hourly simple moving average.
On the upside, an immediate resistance is near the $27,750 level and trading below $27,800 and the 100 hourly simple moving average. It is near the 50% Fib retracement level of the downward move from the $28,879 swing high to $26,623 low.
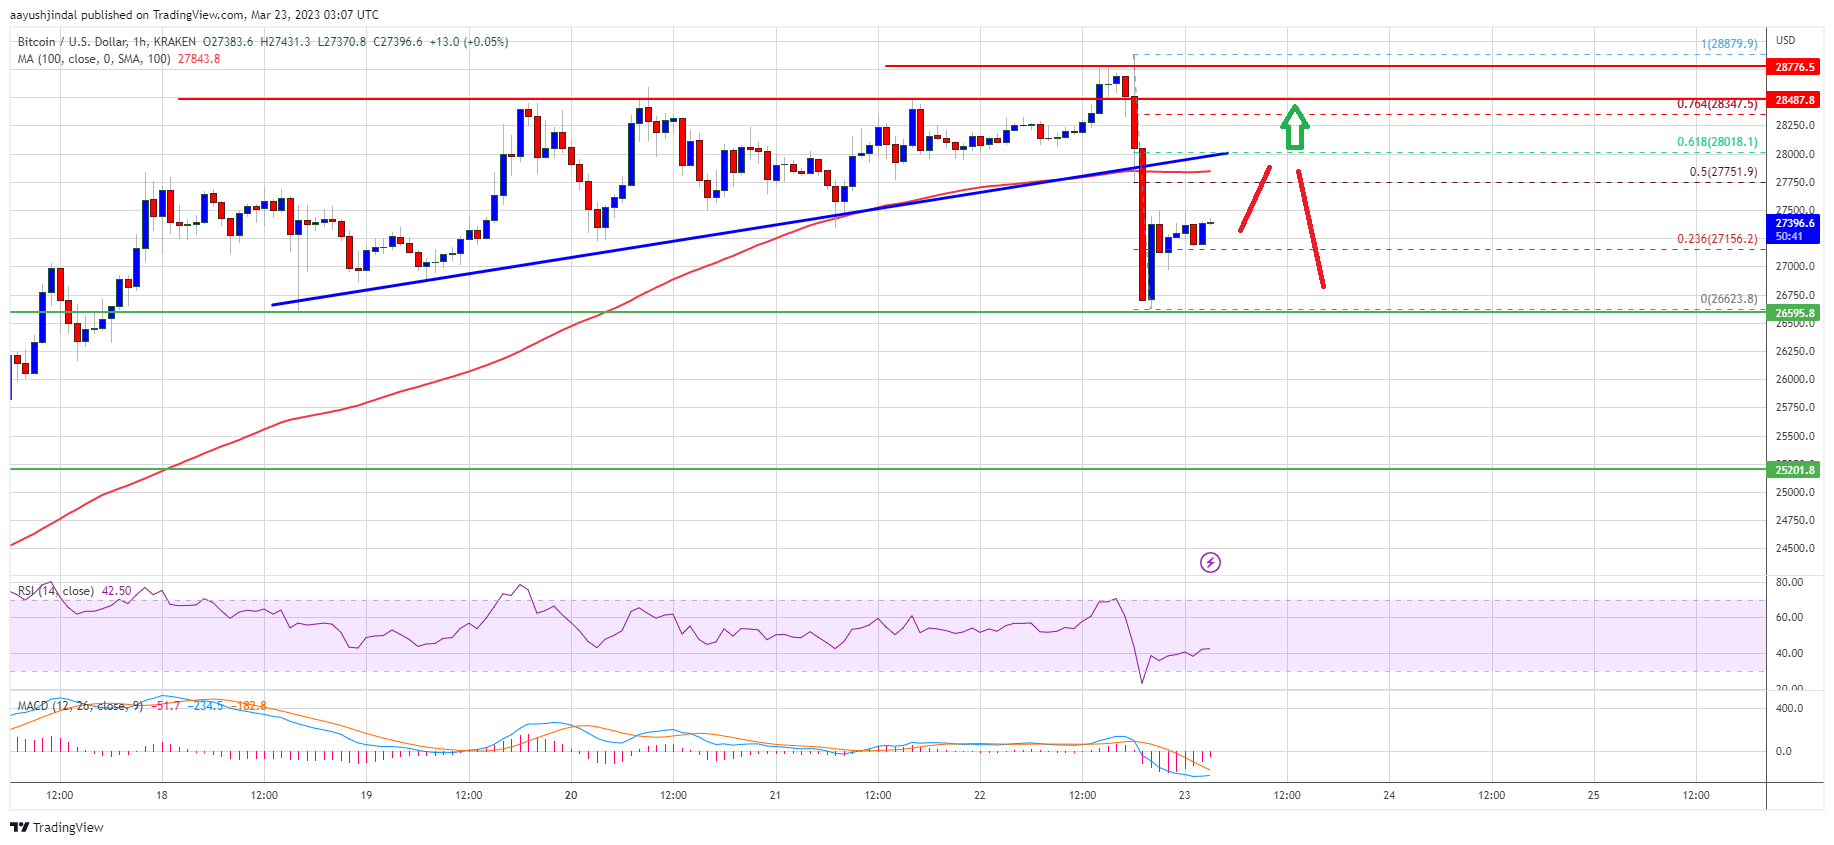
Source: BTCUSD on TradingView.com
The next major resistance is near the $28,000 zone. A close above the $28,000 resistance might start another major increase. In the stated case, the price could rise towards the $28,500 level. Any more gains might send the price towards the $28,850 resistance zone.
Dips Supported in BTC?
If bitcoin price fails to clear the $28,000 resistance, it could start anther decline. An immediate support on the downside is near the $27,000 zone.
The next major support is near the $26,600 zone. Any more losses might send the price towards the $26,000 support zone. The next major support is near the $25,200 level.
Technical indicators:
Hourly MACD – The MACD is now losing pace in the bearish zone.
Hourly RSI (Relative Strength Index) – The RSI for BTC/USD is now below the 50 level.
Major Support Levels – $27,000, followed by $26,600.
Major Resistance Levels – $27,750, $28,000 and $28,500.
Source: Read Full Article