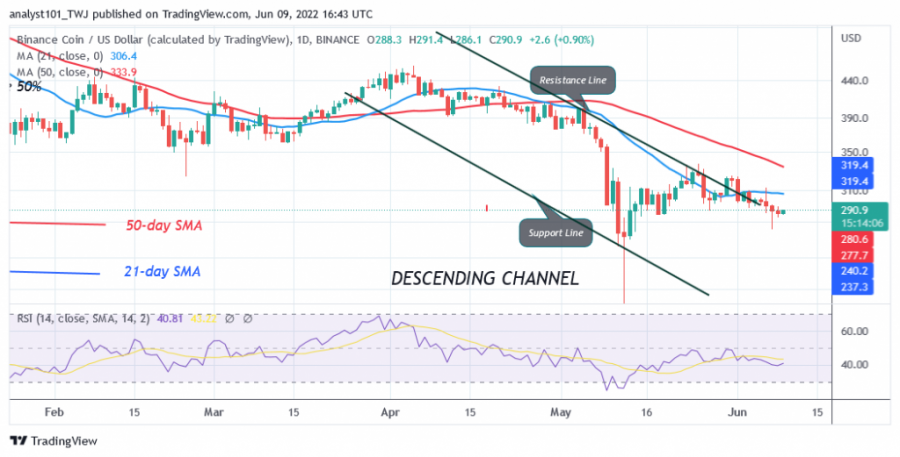
The price of Binance Coin (BNB) is in a downtrend as the price falls below the moving averages. Last week, bulls broke above the 21-day line SMA twice, but were rejected. BNB is now trading below the moving averages, indicating further downward movement of the cryptocurrency.
Further upward movement of the cryptocurrency is limited by the 21-day line SMA. For example, on June 7, the bulls retested the 21-day line SMA, but the altcoin fell to the low of $273. The bulls bought the dips as the price retreated. On the downside, the BNB price could fall further to the previous lows of $268 and $207 if the selling pressure continues. However, if the current support holds, the altcoin could rise back. In the meantime, BNB is trading at $291.50 at the time of writing.
Binance Coin indicator reading

The altcoin is at level 41 of the Relative Strength Index for period 14. The altcoin is in the downtrend zone and continues to fall back to the previous lows. The cryptocurrency’s prices are now below the moving averages, indicating further downward price movement. Binance Coin is below the 40% area of the daily stochastic. This indicates that the market is in a bearish momentum.
Technical indicators:
Major Resistance Levels – $400 and $450
Major Support Levels – $300 and $250
What is the next direction for BNB?
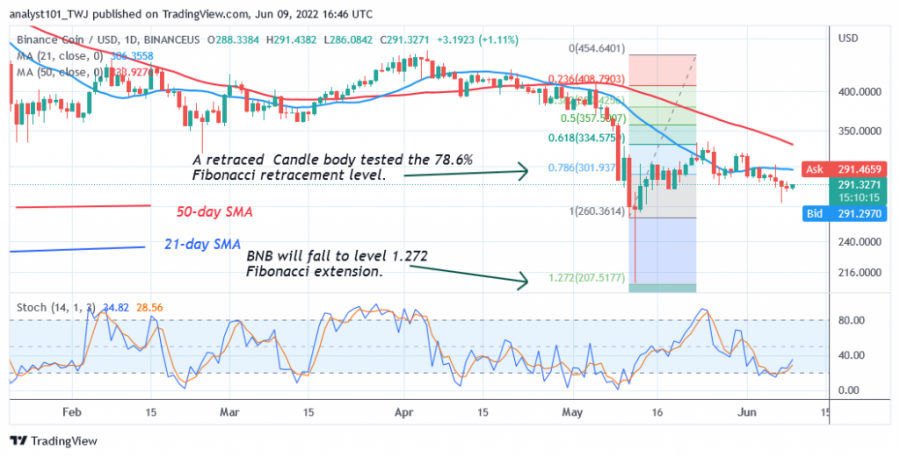
BNB/USD has fallen below the moving averages and faces a rejection of the recent high. The downtrend will continue if the current support at $268 is broken. Meanwhile, on May 12 downtrend, retraced candle body tested the 78.6% Fibonacci retracement level. The retracement suggests that BNB will fall to the level 1.272 Fibonacci extension or $207.51.
Disclaimer. This analysis and forecast are the personal opinions of the author and are not a recommendation to buy or sell cryptocurrency and should not be viewed as an endorsement by CoinIdol. Readers should do their own research before investing funds.
Source: Read Full Article