Despite the lingering bearish sentiment in the market, the Avalanche (AVAX) price has shown some upward movement. AVAX is hovering around a significant support line that has historically propelled its price in previous months. AVAX has experienced a slight 0.1% downward movement on the daily chart, while the weekly chart reflects a loss of approximately 2% in value.
Technical indicators for Avalanche indicate a bearish influence, with demand and accumulation remaining low. For buyers to regain confidence in the market, AVAX must maintain its support level and attempt to break through its resistance level. The appreciation of Bitcoin has also influenced altcoins, prompting some attempts at price increases.

However, if Bitcoin’s price falls below the $27,500 mark, it is unlikely that Avalanche will be able to surpass its next price ceiling. On the other hand, if AVAX manages to break through the overhead resistance, it may experience a rally. The decrease in the AVAX market capitalization suggests that selling pressure still exists in the market.
Avalanche Price Analysis: One-Day Chart
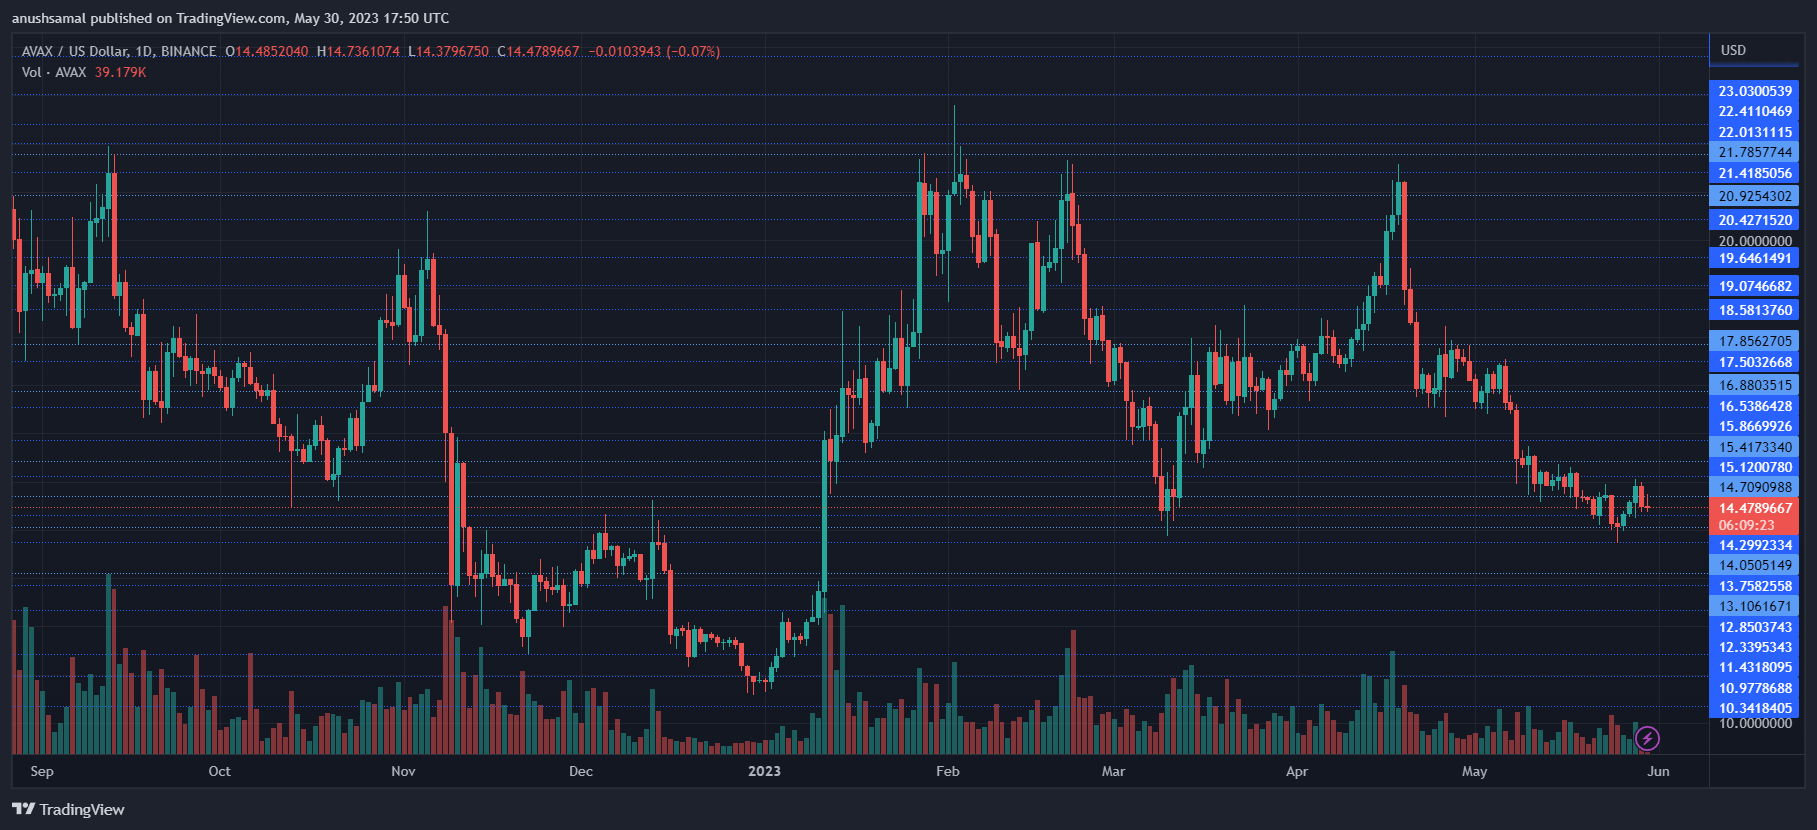
At the time of writing, AVAX was priced at $14.48. If sellers do not exert further pressure, the altcoin will likely make gradual progress on its chart.
The immediate overhead resistance for AVAX is set at $14.70, and surpassing this level could pave the way for further upward movement toward $15 and beyond. On the other hand, a decline from the current price level could bring AVAX down to $14 and potentially lower.
However, if buyers step in and provide a slight push, AVAX bulls can strengthen their position in the market. The trading volume of AVAX in the last session was in red, indicating that selling strength was influencing the price action.
Technical Analysis
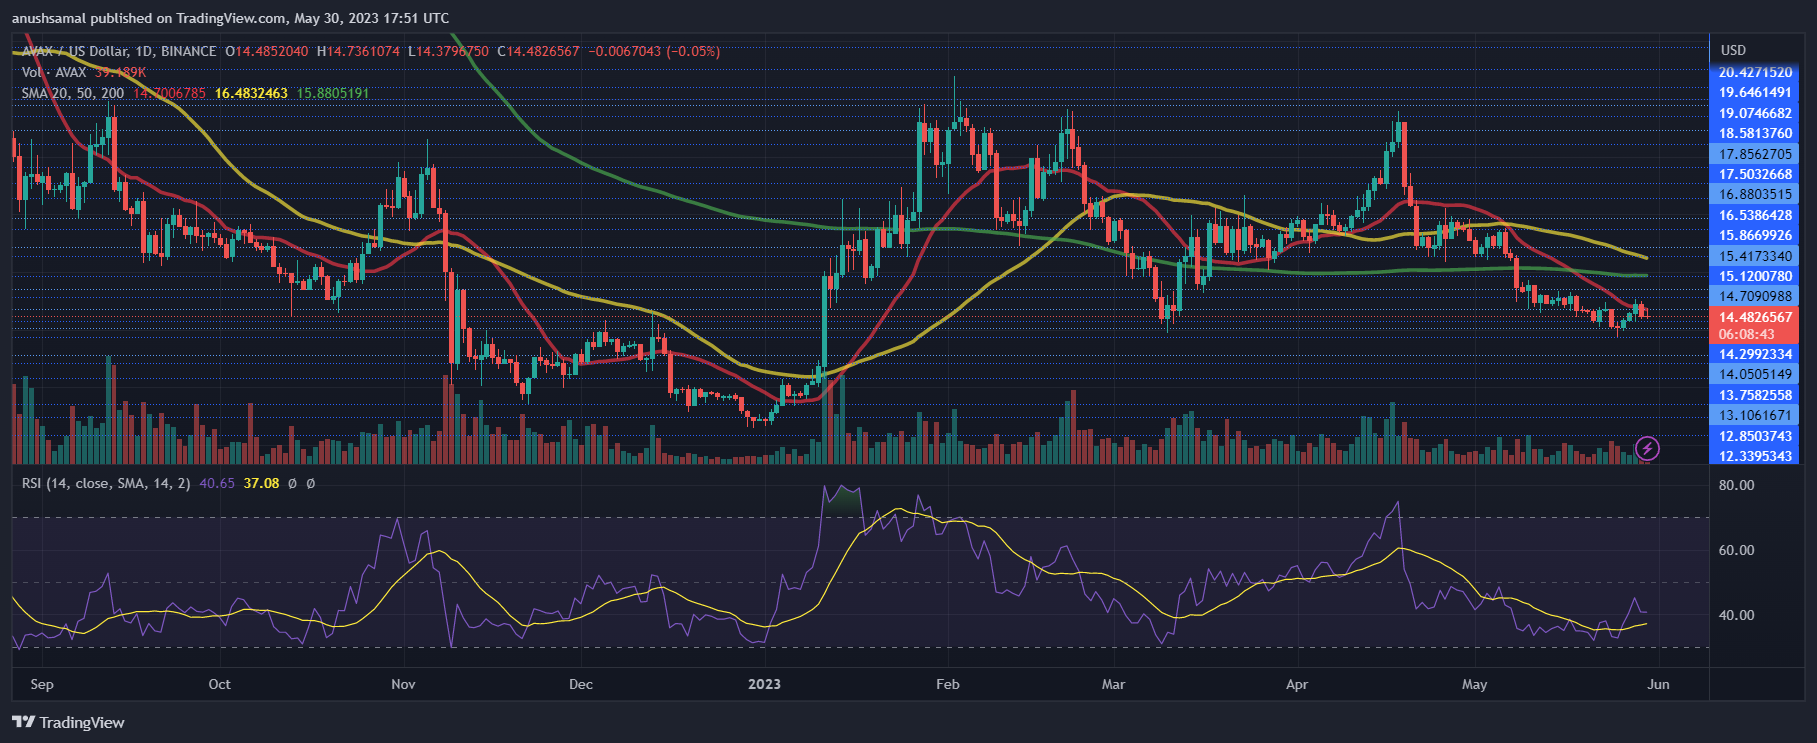
Throughout May, AVAX has experienced a lack of positive demand. The Relative Strength Index (RSI) has remained below the 50-mark, indicating that sellers have outnumbered buyers. The consistent rejection at the current price level could further diminish demand.
Furthermore, AVAX has fallen below the 20-Simple Moving Average (SMA) line, suggesting that sellers have been dictating the price momentum at the time of writing. This indicates a bearish sentiment in the market.
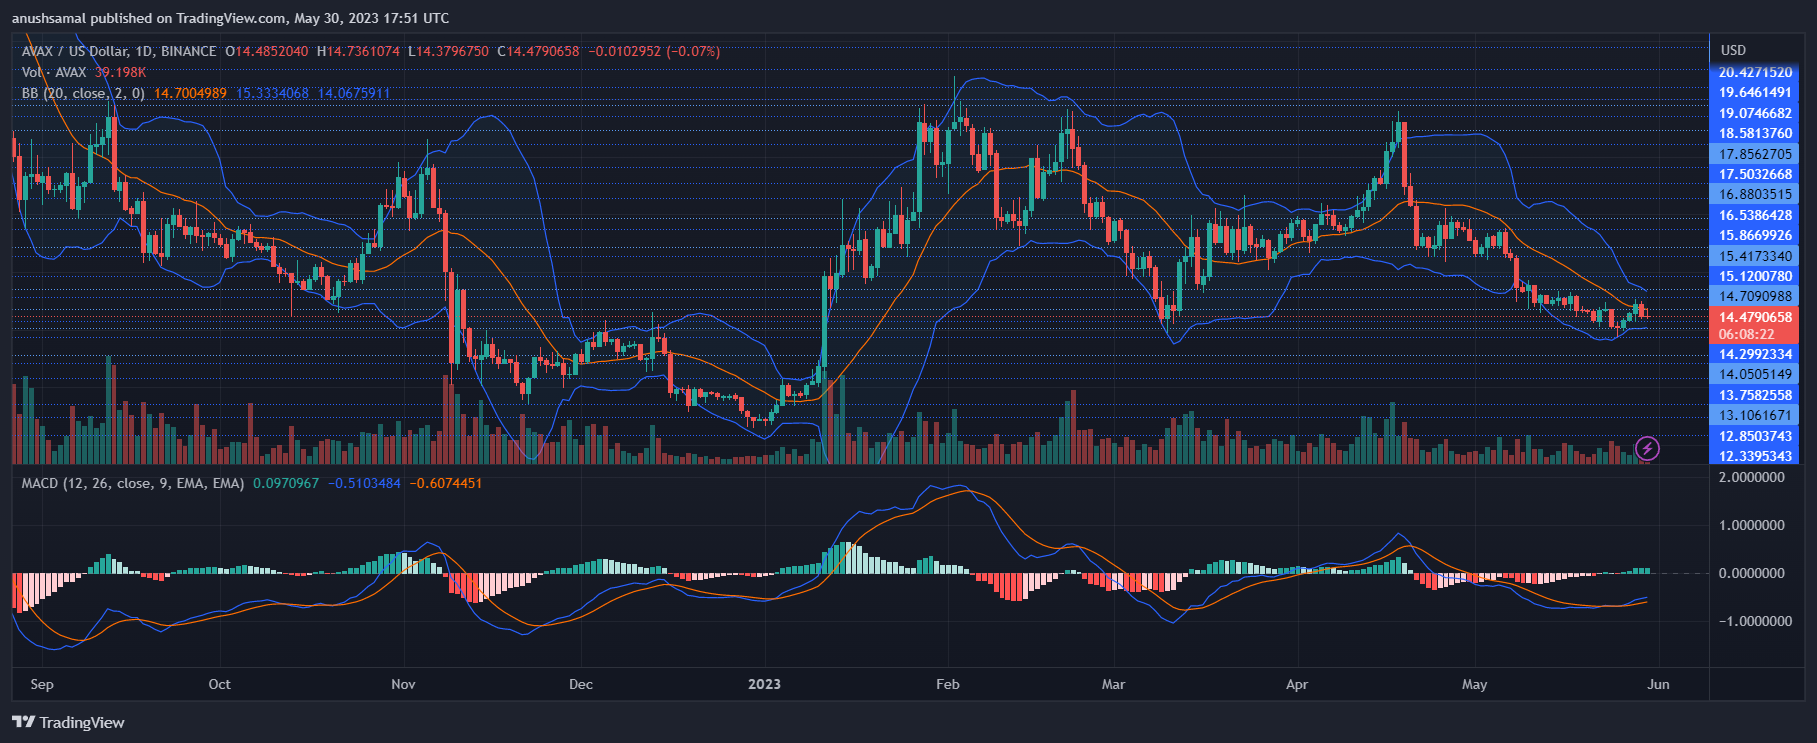
In line with other technical indicators, the buy signal for AVAX has been diminishing. The Moving Average Convergence Divergence (MACD) indicator, which measures price momentum and reversals, has shown declining green histograms, indicating a decrease in buy signals.
Additionally, the Bollinger Bands, which depict price volatility and the potential for price fluctuations, have significantly narrowed. This suggests that AVAX may experience a period of consolidation, with the potential for explosive price action in the upcoming trading sessions.
If AVAX can maintain its position above the current price level, there is a possibility that it might attempt a rally. However, the success of this rally will depend largely on the overall strength of the broader market and the support from buyers.
Source: Read Full Article