Cryptocurrencies such as RNDR, KAVA and TRON have entered uptrend zones as altcoins cross their associated resistance levels. But the downtrend is still a problem for HT and NEO. So let us take a look at a few of these other coins.
Render Token
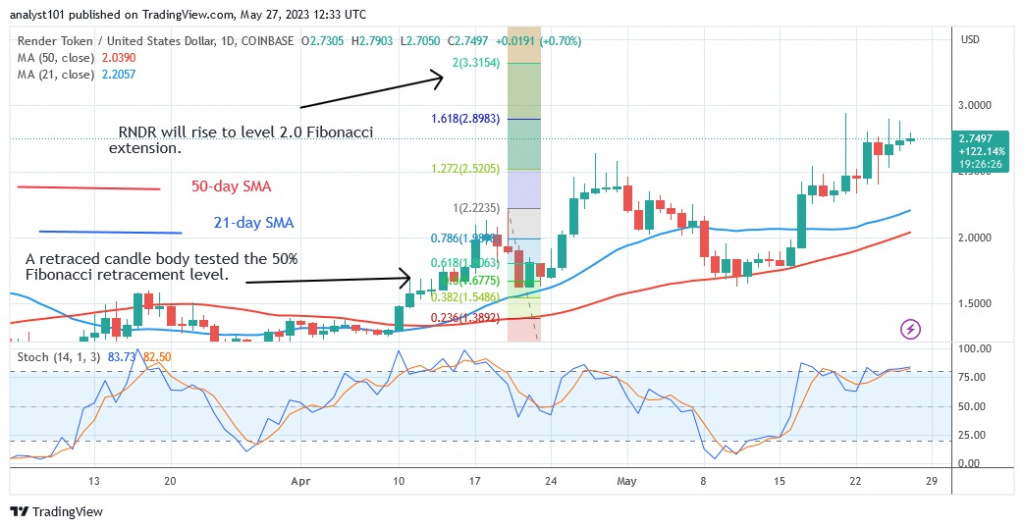
The price of Render Token (RNDR) is in an uptrend as the price breaks above the moving average lines. While the current uptrend continues, the overbought area of the market is getting closer. A bullish exhaustion will eventually stop the trend. At the time of writing, RNDR is currently trading at $2.75. Depending on price indications, the coin’s value may rise. At the April 20 uptrend, a candlestick tested the 50% Fibonacci retracement line. According to the retracement, RNDR will rise to the level 2.0 of the Fibonacci extension or $3.31. Judging by the price action, altcoin is struggling to stay below the $3.00 high. Above the daily stochastic threshold of 75, altcoin is in a positive trend. The best performing cryptocurrency is RNDR, an altcoin that is overbought. It has the following characteristics:
Current price: $2.75
Market capitalization: $1,483,797,255
Trading volume: $220,879,286
7-day gain/loss: 21.97%
Kava
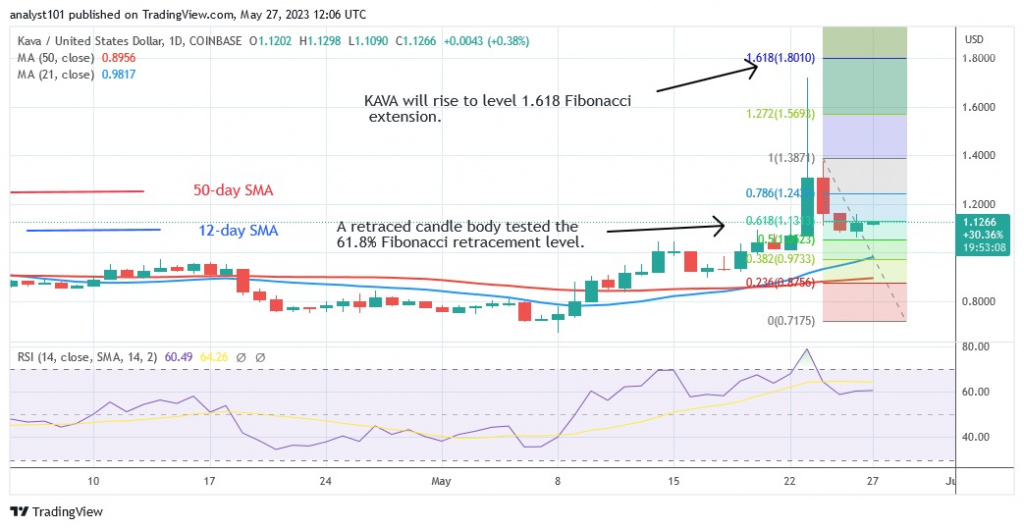
The price of Kava (KAVA) has declined in the uptrend since the high of $1.71. In response to the dips bought by the bulls, the price went down to the low of $1.08. The upward movement has started today. The cryptocurrency asset is likely to rise to its previous highs. A retreating candlestick tested the 61.8% Fibonacci retracement level of the May 23 upswing. According to the retracement, KAVA will rise to the level of 1.618 Fibonacci extension or $1.80. KAVA is currently trading at $1.12 and has started a new upswing. When the price bars are above the moving average lines, the cryptocurrency value will rise. With a Relative Strength Index value of 60 for the 14 period, KAVA is now trading in the positive trend zone. The second best performing cryptocurrency is KAVA. It has the following characteristics:
Current price: $1.13
Market capitalization: $604,008,423
Trading volume: $46,971,544
7-day gain/loss: 12.58%
Huobi Token
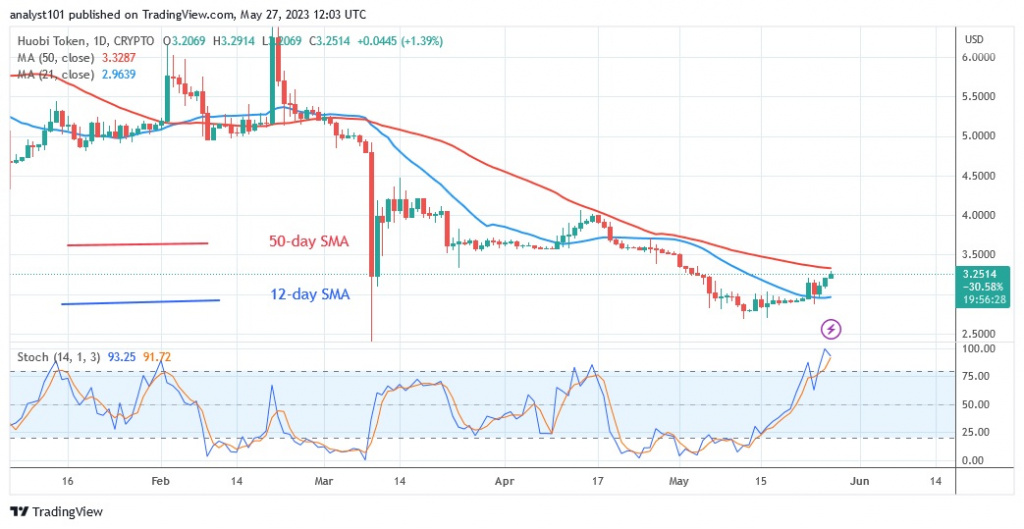
Huobi Token (HT) is making an upward correction after a recent drop below the moving average lines. While the price is above the 21-day line SMA, the bullish momentum has stalled at the 50-day line SMA. In other words, the moving average lines are holding HT. The break of the moving average lines will determine how far the price will rise. On the positive side, it seems unlikely that the market will break above the 50-day line SMA as it is now overbought HT could complete a pullback to the downside. If price falls below the 21-day line SMA, selling pressure may resume. However, if the retracement remains trapped above the 21-day line SMA, HT will be forced to trade in a range for a few days. The upside reached a high of $3.27 today, but is currently in an overbought condition. The daily stochastic value of 80 indicates that the cryptocurrency value is in an uptrend. HT has outperformed other cryptocurrencies and is in third place.
Current price: $3.27
Market capitalization: $1,633,247,354
Trading volume: $12,733,815
7-day gain/loss: 11.73 %
TRON
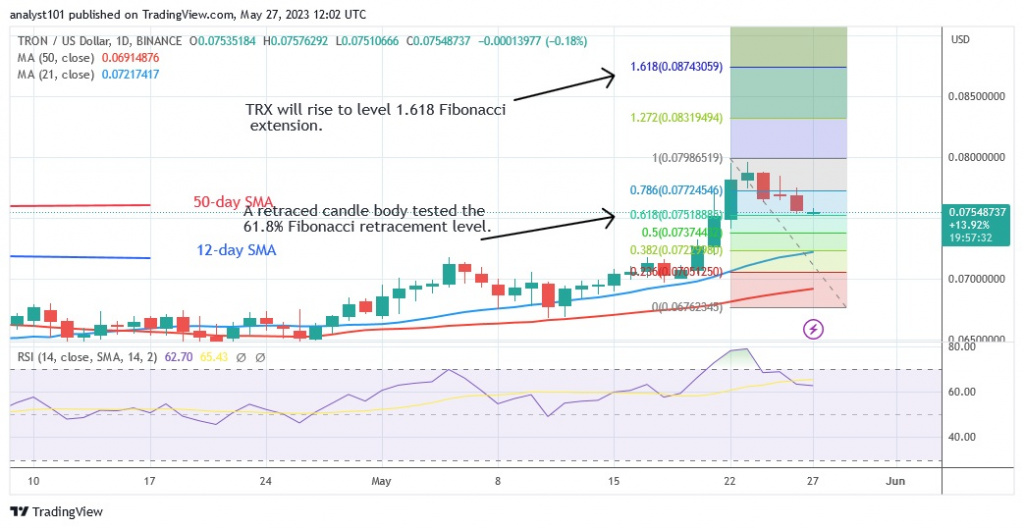
TRON (TRX) is in an uptrend, but is retreating above the moving average lines.
The altcoin is starting a new climb, although it is facing resistance at the high of $0.080. If the initial resistance is broken, we can expect the cryptocurrency value to rise. A retraced candlestick tested the 61.8% Fibonacci retracement line on May 22 during an uptrend. The retracement suggests that TRX will rise to the $0.087 level of the 1.618 Fibonacci extension. If the altcoin is not able to break this resistance level, it will be forced to go sideways below it. With a Relative Strength Index value of 64 for the period 14, TRX is in the uptrend zone. The fourth best performing cryptocurrency is TRX. This one has the following characteristics:
Current price: $0.0762
Market capitalization: $6,881,693,477
Trading volume: $206,783,291
7-day gain/loss: 6.62%
Neo
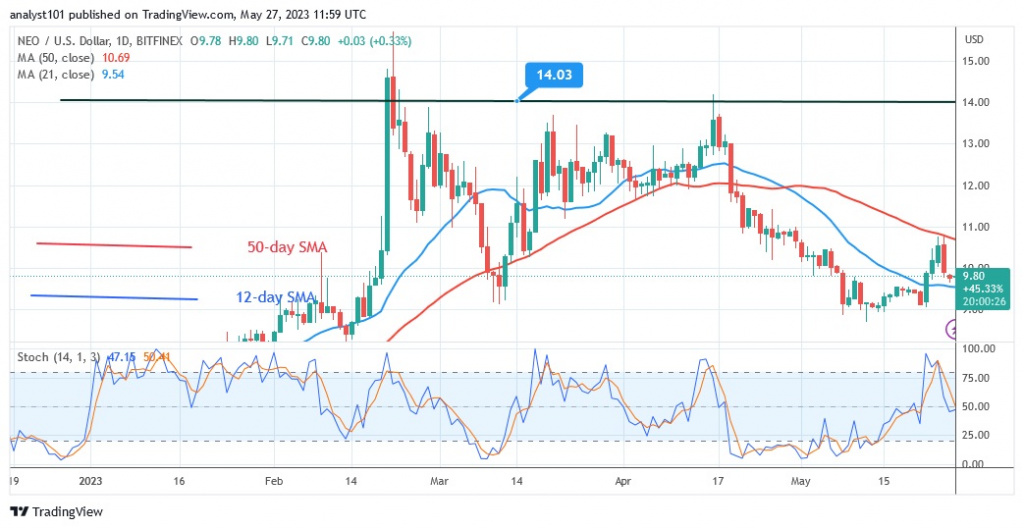
Neo (NEO) is in a downtrend but correcting upwards. The altcoin hit a low of $8.87 on May 9 during the slump, but the bulls bought the dips. When the price of NEO rose above the 21-day SMA line, a retracement to the upside occurred, but positive momentum remained at the 50-day SMA line. NEO is currently resetting from the recent high and trading between the moving average lines.
The altcoin is currently trading at $9.78. NEO is trapped between the moving average lines and will be forced to move within a trading range. If the price slips below the 21-day SMA line, selling pressure will resume. The market will fall to its previous low of $9.01 before recovering. Below the daily stochastic threshold of 50, the altcoin is in bearish momentum. The characteristics of NEO, the fifth best performing cryptocurrency, are as follows:
Current price: $9.76
Market capitalization: $978,562,438
Trading volume: $30,035,742
7–day gain/loss: 3.80%
Disclaimer. This analysis and forecast are the personal opinions of the author and are not a recommendation to buy or sell cryptocurrency and should not be viewed as an endorsement by CoinIdol. Readers should do their own research before investing in funds.
Source: Read Full Article

