The price of TRON (TRX) fluctuates in a narrow range.
TRON price long-term forecast: bearish
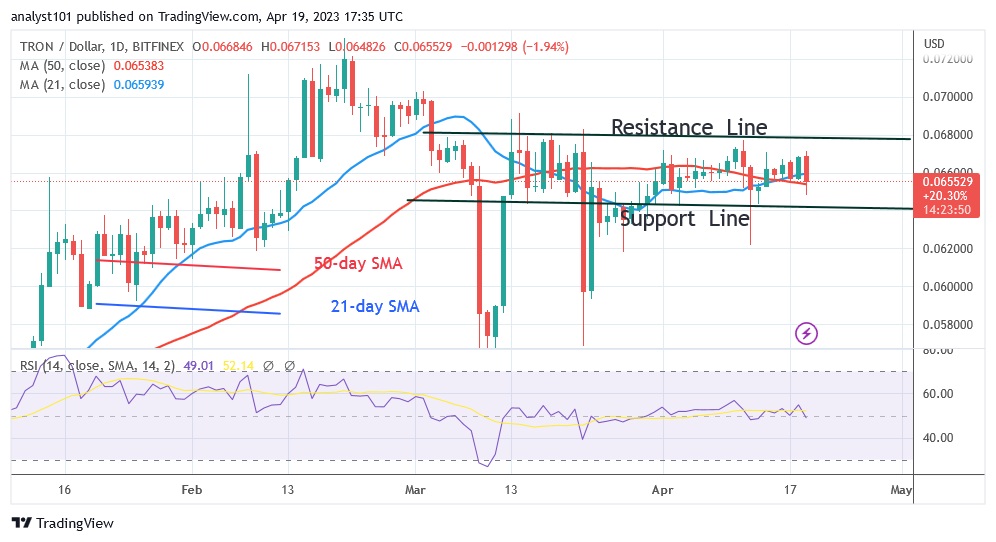
The cryptocurrency’s price is hovering between $0.064 and $0.068. It has been trading above the moving average lines since April 10 as buyers try to keep the price above the $0.068 resistance level. Buyers were thwarted when the cryptocurrency fell below the moving average lines. At $0.065, TRON is currently trading between the moving average lines. Had the buyers been successful above the resistance line, TRON would have risen to its previous high of $0.072. However, the resistance has not changed since March 3. After the price of the cryptocurrency crossed the moving average lines yesterday, it is falling today. The long tails of the candlesticks show strong buying at lower price levels. The location of the price bar in the middle of the moving average lines suggests that the movement will remain within the range.
TRON indicator display
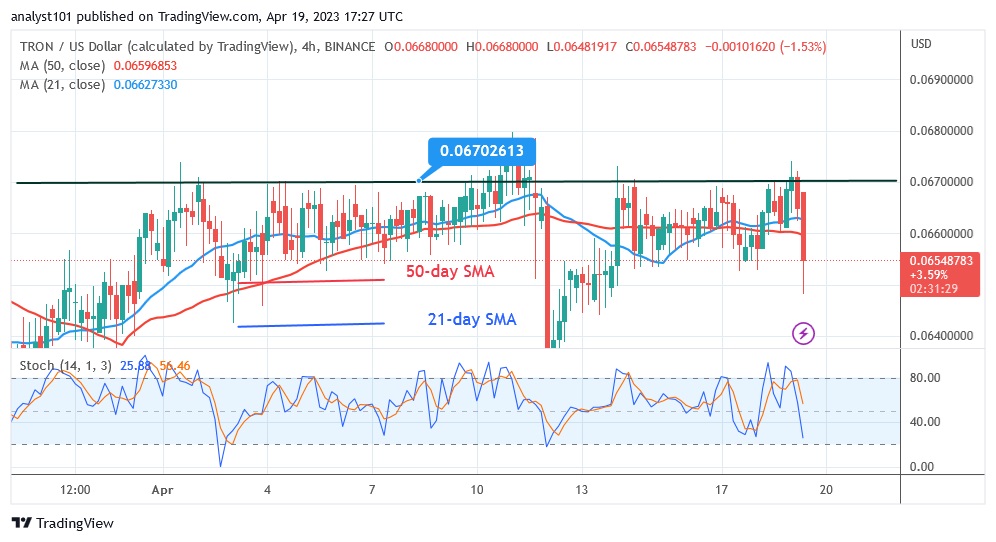
TRON is at level 49 of the Relative Strength Index for the period 14. The price of the crypto asset has reached its equilibrium point. This indicates a balance between supply and demand. The price bars are still moving sideways while crossing the moving average lines. TRON is currently in a negative momentum below the daily stochastic threshold of 40.
Important supply zones: $0.07, $0.08, $0.09
Important demand zones: $0.06, $0.05, $0.04
What is the next direction for TRON?
The price of TRX/USD has been moving sideways for the past month. Since the price bars are in the middle of the price range, it is likely that the movement will continue within the range. The moving average lines have maintained their horizontal slope. As the market approaches the oversold area, the bearish momentum has weakened.
Disclaimer. This analysis and forecast are the personal opinions of the author and are not a recommendation to buy or sell cryptocurrency and should not be viewed as an endorsement by Coin Idol. Readers should do their own research before investing in funds.
Source: Read Full Article


