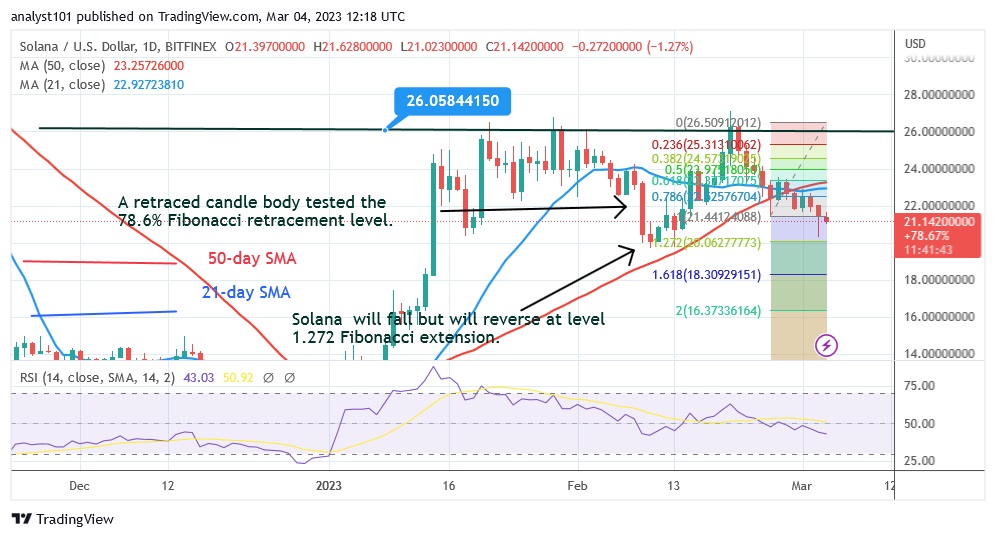
Solana (SOL) has strayed below the moving average lines despite a sideways trend.
Solana price long-term forecast: bearish
The cryptocurrency is currently trading at a low of $20, and if support is found above this level, the altcoin will start to rise. The indicator predicts that Solana will fall and then turn around at $20. It seems unlikely that the price of the cryptocurrency will fall below the support level of $20. Since the upswing that started on January 21, Solana was forced to trade sideways between $20 and $26. There have been four unsuccessful attempts by buyers to keep the price above the upper resistance of $26. Solana will resume its uptrend if the bulls overcome the $26 overhead resistance today. The cryptocurrency will rise to a high of $36. If the price falls below the current $20 support level, the downtrend will resume.
Solana price indicator analysis
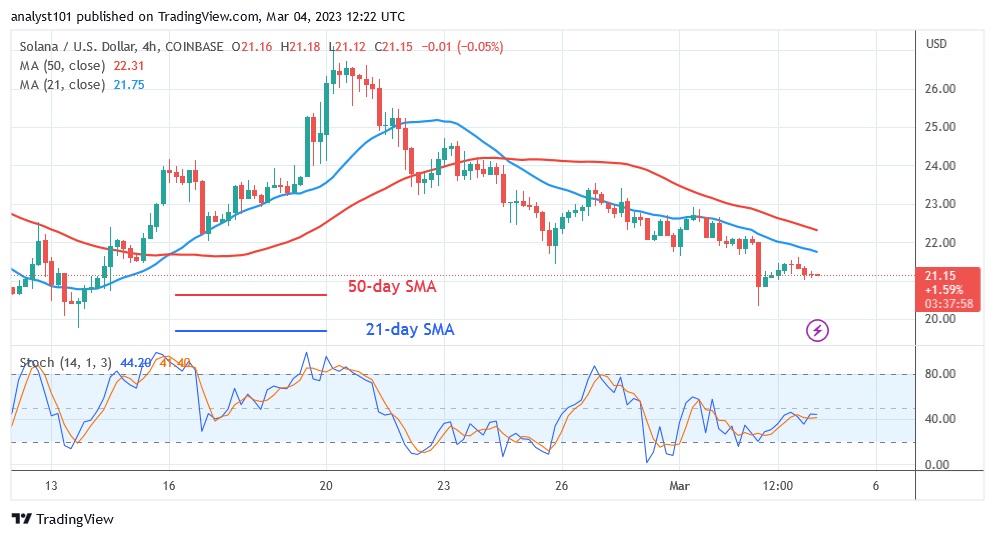
Solana is at level 43 of the Relative Strength Index for the period of 14. It is in a downward trend and could go even lower. The price of the cryptocurrency is falling as long as the price bars are below the moving average lines. Above the daily stochastic level of 40, the upward momentum has stalled. A sideways trend is indicated by the horizontal slope of the moving average lines.
Technical indicators
Key supply zones: $60, $80, $100
Key demand zones: $50, $30, $10
What is the next move for Solana?
Solana has been in a sideways trend since January 14, as buyers have failed to break through the $26 level. The market will decline and continue to trade in a range once the $26 resistance level is retested. As long as the trading range level is not broken, the movement will continue.
Disclaimer. This analysis and forecast are the personal opinions of the author and are not a recommendation to buy or sell cryptocurrency and should not be viewed as an endorsement by CoinIdol. Readers should do their own research before investing in funds.
Source: Read Full Article


