The Ripple (XRP) price is rising, but the upward movement has encountered resistance at $0.55.
Long-term forecast for the Ripple price: bullish
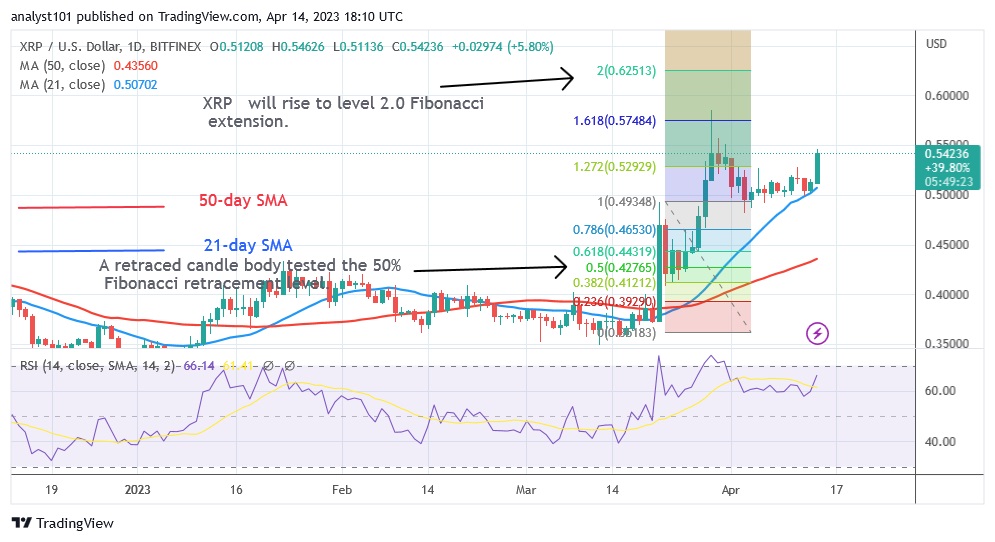
During the uptrend on March 29, XRP rose to a high of $0.58 before being halted. Any further rise was stopped by the resistance at $0.55. The price of XRP is currently at $0.54 as the bulls try to overcome the resistance. According to the price indicator, XRP will rise to a high of $0.62 if the bulls manage to break the current resistance. On the other hand, if the recent high is rejected, the cryptocurrency value will fall and continue to move in a range. XRP fell in the last price action and started to fluctuate between $0.50 and $0.55.
Ripple indicator analysis
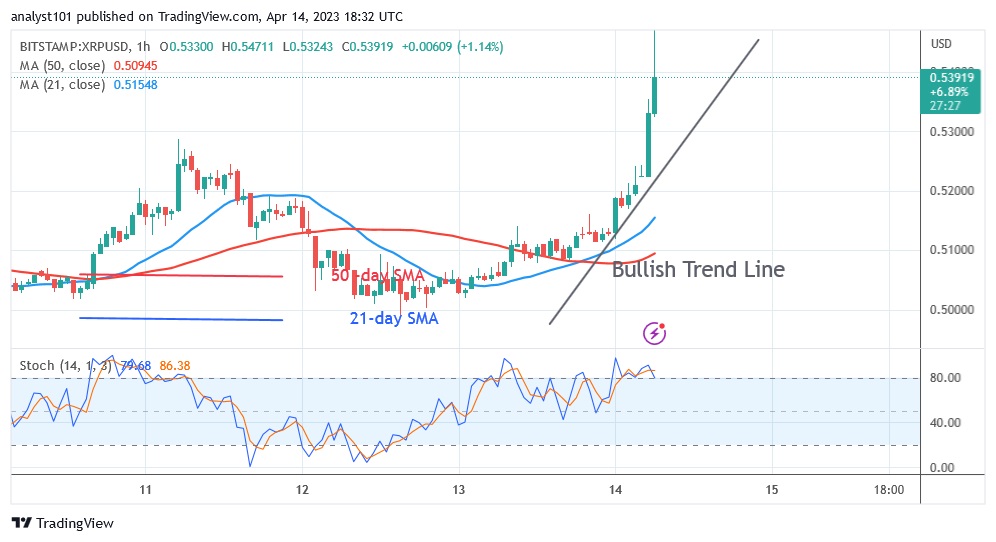
The Relative Strength Index for period 14 shows that Ripple is currently trading at the 59 level. As long as XRP is in the bullish trend zone, it will rise but test the recent high. As the price bars are higher than the moving average lines, the value of the cryptocurrency will continue to rise. Ripple is experiencing bearish momentum below the daily stochastic level of 80, and as the market enters the overbought zone, XRP may fall.
Technical indicators:
Key resistance levels – $0.80 and $1.00
Key support levels – $0.40 and $0.20
What is the next move for Ripple?
Although XRP/USD reached a high of $0.54 today, it failed to break above the resistance zone. The altcoin has reportedly reached the overbought zone of the market. The altcoin is falling back to its breakout level of $0.47. In other words, it will be forced to trade only within the price range of $0.50 to $0.55.
Disclaimer. This analysis and forecast are the personal opinions of the author and are not a recommendation to buy or sell cryptocurrency and should not be viewed as an endorsement by CoinIdol. Readers should do their own research before investing
Source: Read Full Article


