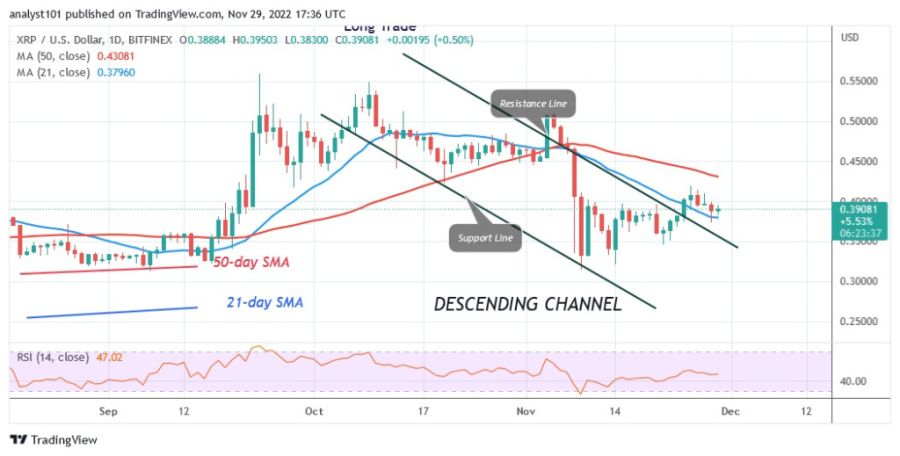
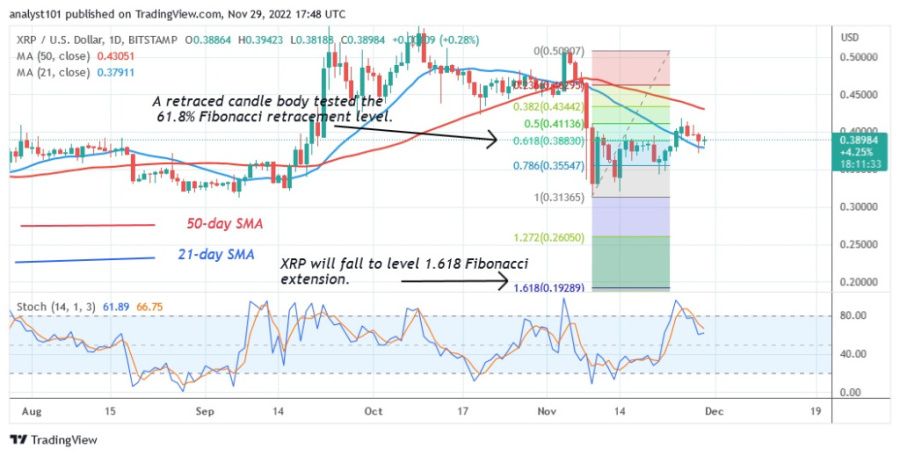
The price of Ripple (XRP) is falling as buyers fail to keep the price above the moving average lines. The cryptocurrency has been rejected lately at its all-time high of $0.40 and is now turning around.
Ripple price long-term forecasts: bearish
The altcoin will fall into the range between the $0.31 and $0.40 levels if the price drops below the 21-day line SMA. However, if the price continues to trade above the 21-day line SMA, XRP will return to its previous highs. On the plus side, if XRP breaks above the moving average lines, it will rise to its previous high of $0.55. However, if XRP is rejected at the recent high, it will fall and trade in a range between $0.31 and $0.40.
Ripple indicator analysis
For the period 14, Ripple is at level 47 on the Relative Strength Index. After the recent rejection, it is now in the downtrend zone. As long as the cryptocurrency trades within the moving average lines, the sideways movement will continue. The downtrend is indicated by the slope of the 50-day line and the 21-day line SMA. As it is moving up again, XRP is above the level 60 of the daily stochastic.
Technical Indicators
Key resistance levels – $0.80 and $1.00
Key support levels – $0.40 and $0.20
What is the next step for Ripple?
As shown by the break above the 21-day line SMA, Ripple has reversed its previous downtrend. For a possible upside move, the cryptocurrency is moving above the 21-day line SMA. If the price moves above the 50-day line SMA, the uptrend begins. On the other hand, if the moving average lines fail to break the recent high, the range-bound movement will resume.
Disclaimer. This analysis and forecast are the personal opinions of the author and are not a recommendation to buy or sell cryptocurrency and should not be viewed as an endorsement by CoinIdol. Readers should do their own research before investing
Source: Read Full Article


