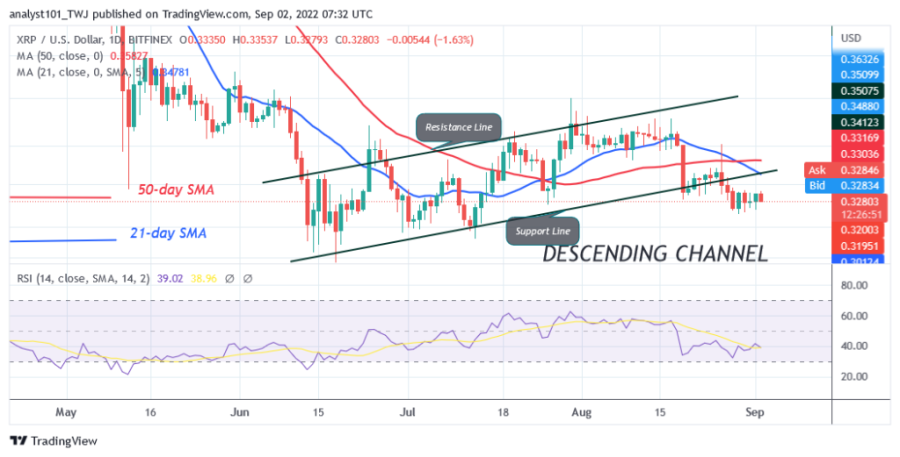
The price of Ripple (XRP) remains in a downward correction as the cryptocurrency holds above the $0.32 support. Last week, XRP continued its movement between $0.32 and $0.35.
Buyers have continued to defend the $0.32 support as demand dries up at a higher price level. The Ripple price will change if the trading range level is broken. For example, if XRP turns down from the moving average lines and breaks below the $0.32 support, XRP will fall to the $0.30 support. If buyers re-enter the uptrend and break above the moving average lines, the altcoin will rise to a high of $0.39.
Ripple indicator analysis
Ripple is at level 41 of the Relative Strength Index for the period 14. The RSI has remained the same as the altcoin is limited to a range. The crypto’s price bars are below the moving average lines, which indicates further downward movement of the cryptocurrency. The altcoin is above the 25% range of the daily stochastic. XRP is in a bullish momentum. The 21-day line SMA and the 50-day line SMA are sloping south, indicating a downtrend.
Technical indicators
Key Resistance Zones: $0.40, $0.45, $0.50
Key Support Zones: $0.30, $0.25, $0.20
What is the next move for Ripple?
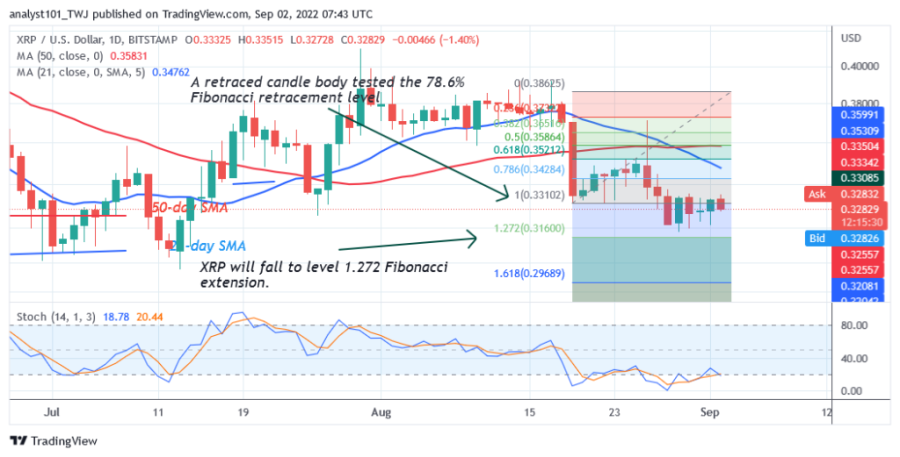
Ripple is in a range-bound move as the altcoin holds above the $0.32 support. Meanwhile, the August 19 downtrend has shown a candle body testing the 78.6% Fibonacci retracement level. The retracement suggests that XRP will fall to the 1.272 Fibonacci Extension $0.31 level.
Disclaimer. This analysis and forecast are the personal opinions of the author and are not a recommendation to buy or sell cryptocurrency and should not be viewed as an endorsement by CoinIdol. Readers should do their own research before investing.
Source: Read Full Article


