The Ethereum price (ETH) remains in a steady uptrend after reaching a high of $1,620 on January 4.
Long-term analysis of the Ethereum price: bullish
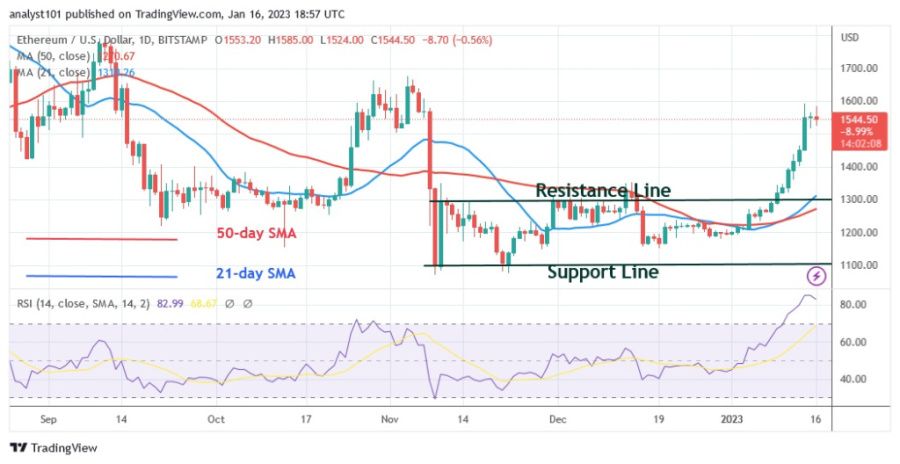
The largest altcoin is back to its previous price level, which was $1,678 on Nov. 5. Since January 4, the uptrend has stagnated near the high of $1,620. The cryptocurrency is currently bouncing below the $1,600 resistance level. As the market is extremely overbought, the current bounce is being hindered. The $1,678 resistance level will be breached if buyers keep the price above $1,600 and the uptrend continues. Ether will then rise to the next resistance level of $1,789. If Ether is rejected at the high of $1,600, selling pressure will resume. The cryptocurrency will fall to the breakout level of $1,352. If Ether stays above $1,300, it will be forced to move between $1,300 and $1,600. At the time of writing, Ether is trading at $1,544.
Ethereum indicator analysis
With a reading of 82 on the Relative Strength Index for the 14 period, Ether is in overbought territory. The largest altcoin is dangerously overbought and could fall. The moving average lines that cause the price to rise are above the current price. Below the daily stochastic level of 80, Ether has bearish momentum. The altcoin may lose value.
Technical indicators:
Key resistance levels – $2,000 and $2,500
Key support levels – $1,500 and $1,000
What is the next direction for Ethereum?
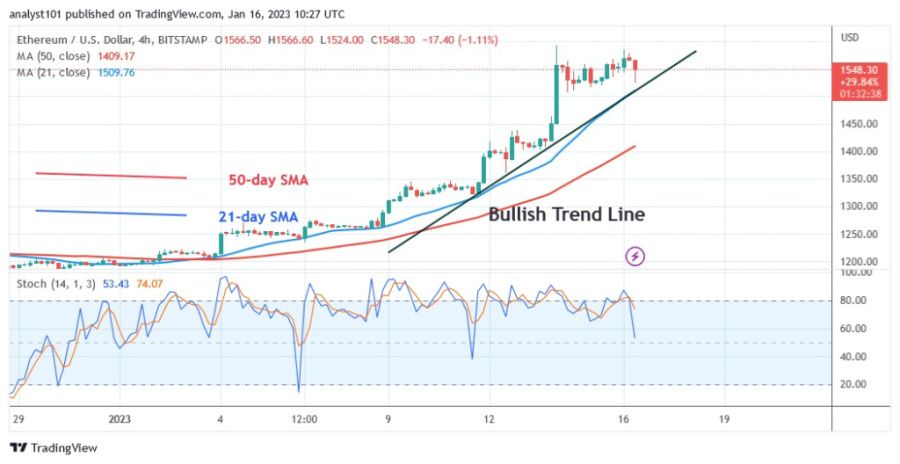
Ether is in a sideways movement below the $1,600 resistance zone on the 4-hour chart. The altcoin is fluctuating between $1,506 and $1,600. If the price falls below the trend line or the moving average lines, the downtrend will resume.
Disclaimer. This analysis and forecast are the personal opinions of the author and are not a recommendation to buy or sell cryptocurrency and should not be viewed as an endorsement by CoinIdol. Readers should do their research before investing in funds.
Source: Read Full Article


