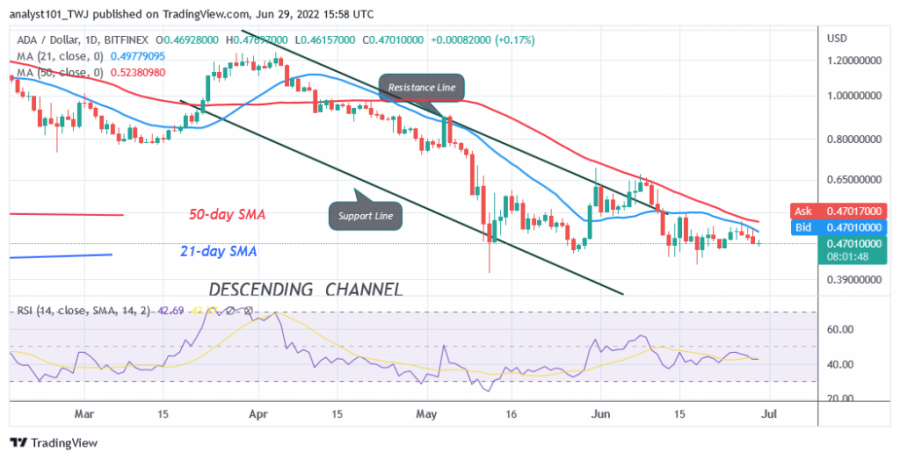
The price of Cardano (ADA) is in a downward correction, but consolidating in a narrow range between $0.44 and $0.55 price levels. The upward movement was limited by the 21-day line SMA. On June 26, the cryptocurrency was bumped off the 21-day line SMA as the altcoin resumed its downward movement.
Meanwhile, ADA/USD fluctuates between $0.44 and $0.55. ADA price is bearish and could fall below $0.44 support. Cardano could decline and regain the previous low of $0.40. On the other hand, if the $0.44 support holds, the price could rise to $0.70. Meanwhile, ADA is trading at $0.46 at the time of writing.
Cardano indicator analysis
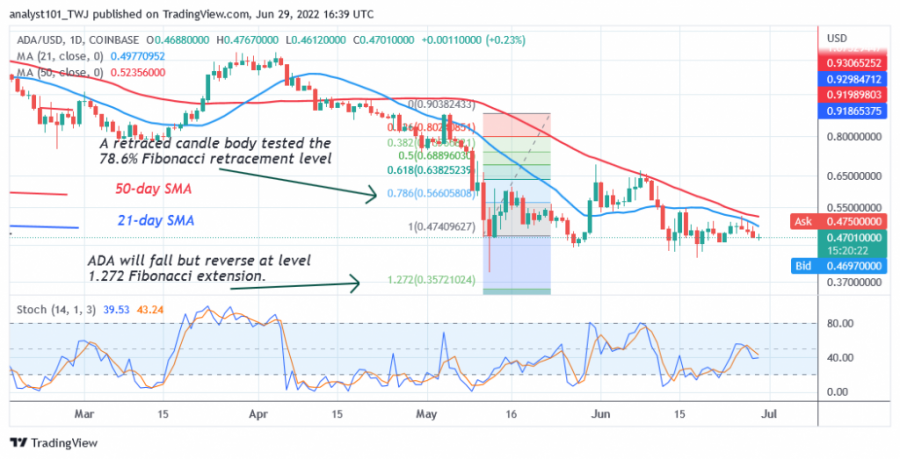
Cardano is at level 42 on the Relative Strength Index for period 14, and the RSI has remained stable due to little price movement. The price bars of the cryptocurrency are below the moving averages, indicating a possible decline. The daily stochastic is below the 40% area. ADA is in a bearish momentum and the market has reached the oversold area.
Technical Indicators:
Key Resistance Zones: $1.00, $1.20, $1.40
Key Support Zones: $0.80, $0.60, $0.40
What is the next move for Cardano?
Cardano is in a downtrend after rejecting the high at $0.52. The downtrend will continue if the bears fall below the $0.44 support. Meanwhile, on May 12 downtrend, a retraced candle body tested the 78.6% Fibonacci retracement level. The retracement suggests that ADA will fall, but will reverse at a level of 1.272 Fibonacci extension or $0.35.
Disclaimer. This analysis and forecast are the personal opinions of the author and are not a recommendation to buy or sell cryptocurrency and should not be viewed as an endorsement by CoinIdol. Readers should do their own research before investing funds.
Source: Read Full Article


