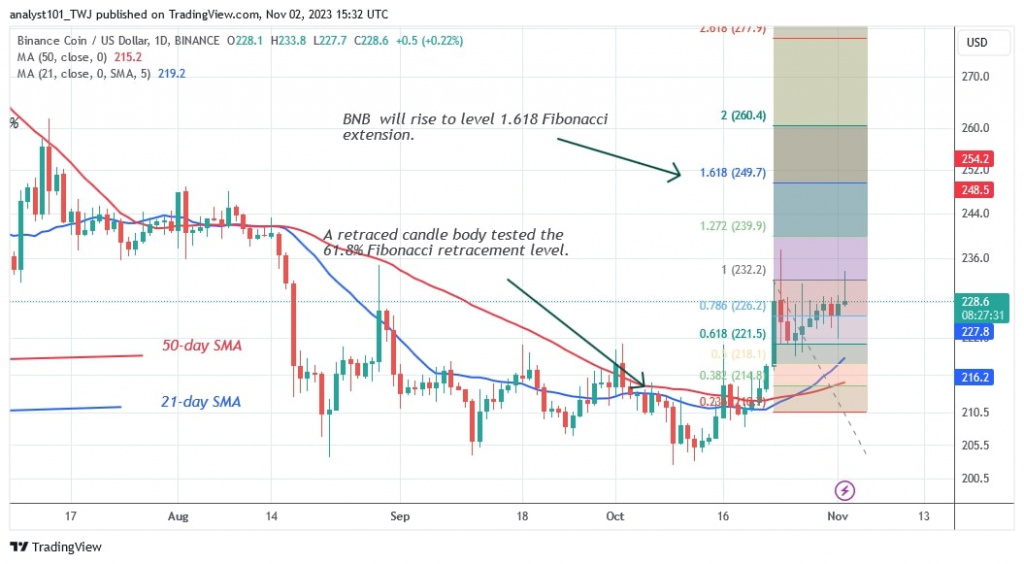
The price of the Binance (BNB) coin has been moving higher over the past week, but a barrier above $235 has halted its growth.
BNB Price Long Term Prediction: Bullish
The bulls have been beaten back and the price of Binance coin faced the $235 resistance level between October 23 and November 2. This has caused the altcoin to fall and find support above the $220 breakout level. On the upside, if buyers break the barrier above $235, the crypto asset is likely to reach a high of $250.
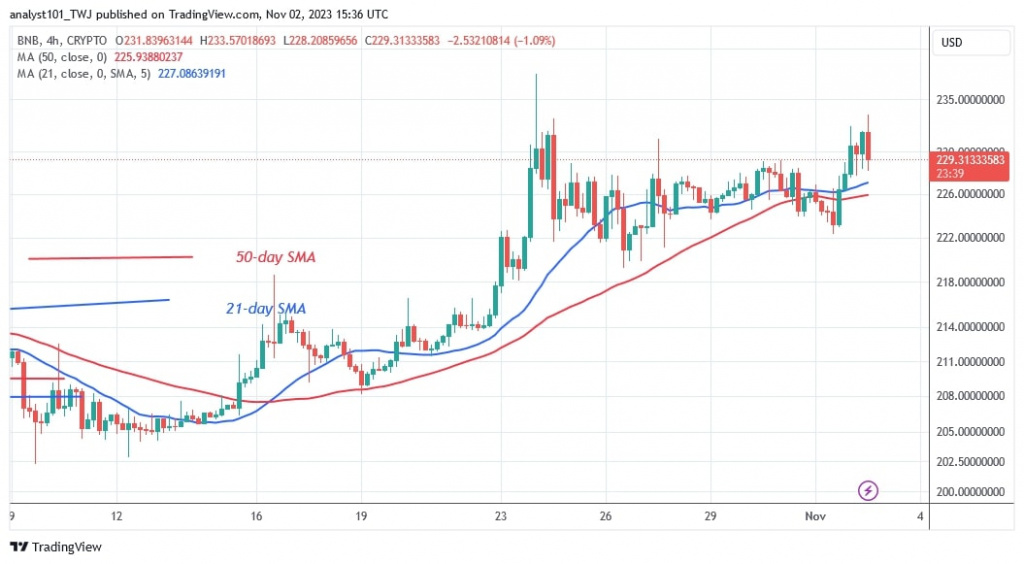
Nonetheless, BNB is currently trading in a range between $220 and $235 as buyers rally to extend the uptrend. Should the bears break the $220 support, the market would return to its previous range of $203 to $220. At the time of writing, BNB is trading at $231.70.
BNB Indicator Reading
On the lower time frame, BNB price bars have retraced above the moving lines with the tail of the extended candle pointing to the 21-day SMA or the low of $227. A candlestick with a long tail indicates strong buying at a lower price level. In addition, the moving average lines run horizontally in different directions. Consequently, the sideways movement will continue.
Technical indicators:
Key resistance levels – $300, $350, $400
Important support levels – $200, $150, $100
What is the next direction for BNB/USD?
Binance coin is again moving sideways between $220 and $235 as buyers have failed to break the resistance at $235. The price could continue to rise and retest the resistance as long as it remains above the moving average lines.
On October 31, Coinidol.com reported that the previous uptrend was expected to be rejected, BNB was approaching the resistance at $237.
Disclaimer. This analysis and forecast are the personal opinions of the author and are not a recommendation to buy or sell cryptocurrency and should not be viewed as an endorsement by CoinIdol.com. Readers should do their research before investing in funds.
Source: Read Full Article


