Cryptocurrency analysts of Coinidol.com report, The BNB price is at the bottom of the chart.
BNB price long term forecast: bearish
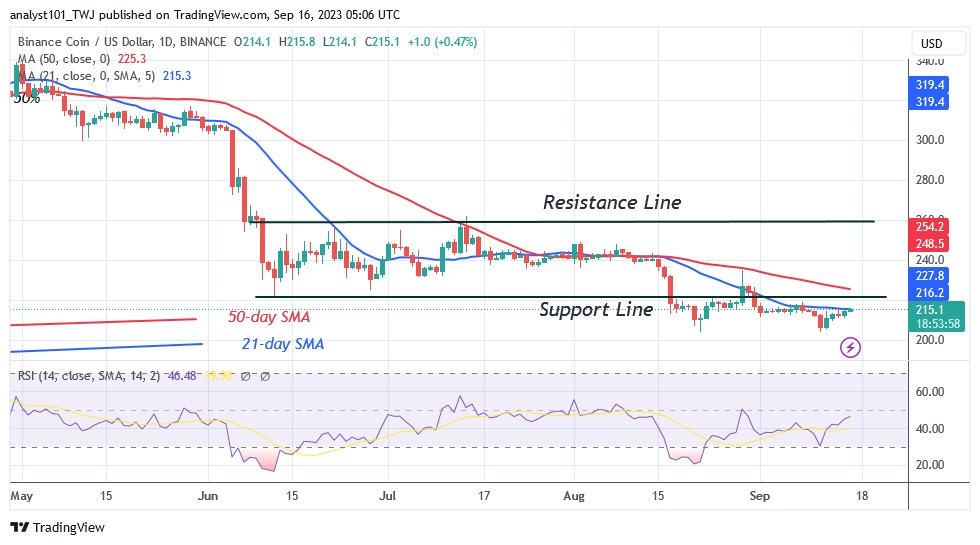
The resistance at $216, or the 21-day line SMA, is currently slowing down the upward movement. Beyond that, BNB’s price fluctuates between $200 and $216. At the time of writing, the altcoin is valued at $215.
The altcoin is now rejected at the 21-day line SMA. If selling pressure picks up, the market will fall to its previous low of $203. As long as the current support holds, the movement could continue within the trading range. However, the price indication shows that BNB could fall to the low of $192 if the current support is broken. In the meantime, the market will oscillate between $200 and $216.
BNB indicator display
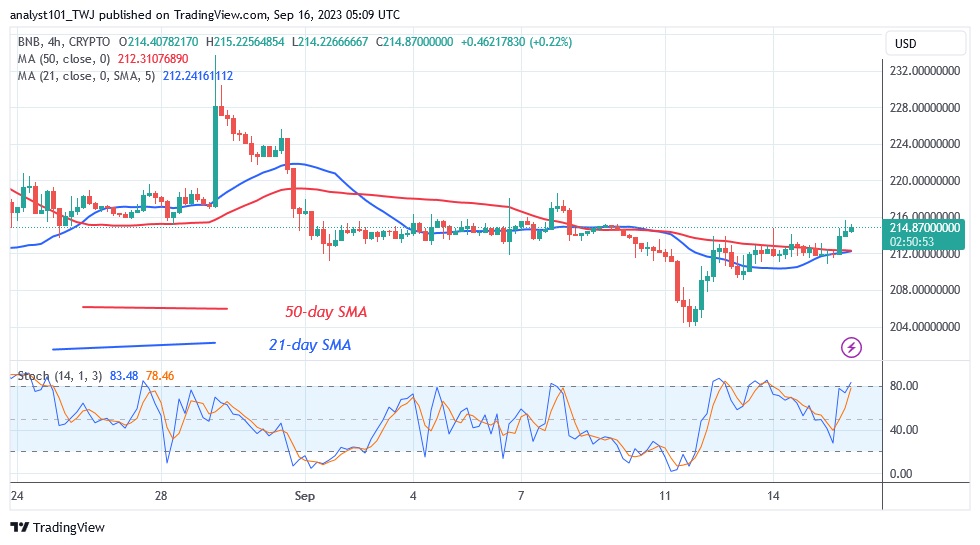
BNB has maintained its trading range at the Relative Strength Index 46 level for the 14 period. The 21-day line SMA has become the resistance line of the price bar. If the price breaks above the simple moving average of the 21-day line, the uptrend will resume. The bullish momentum has currently paused above the 80 level of the Stochastic on the daily chart. BNB is in an overbought zone and could fall.
Technical Indicators:
Key resistance levels – $300, $350, $400
Key support levels – $200, $150, $100
What is the next direction for BNB/USD?
BNB is in a downtrend and could fall further to the previous low of $203. The altcoin is currently trading between $200 and $216 per coin. The price of the cryptocurrency is retesting the recent high in order to break it. BNB will crash if it fails to break the recent high.
As we reported on September 09, the altcoin has reached a high of $218.80, but is rejected at this level. Buyers are struggling to keep the price above the $220 level.
Disclaimer. This analysis and forecast are the personal opinions of the author and are not a recommendation to buy or sell cryptocurrency and should not be viewed as an endorsement by CoinIdol.com. Readers should do their research before investing in funds.
Source: Read Full Article


