Bitcoin (BTC) price is fluctuating after the bearish decline on June 5.
Bitcoin price long term forecast: bearish
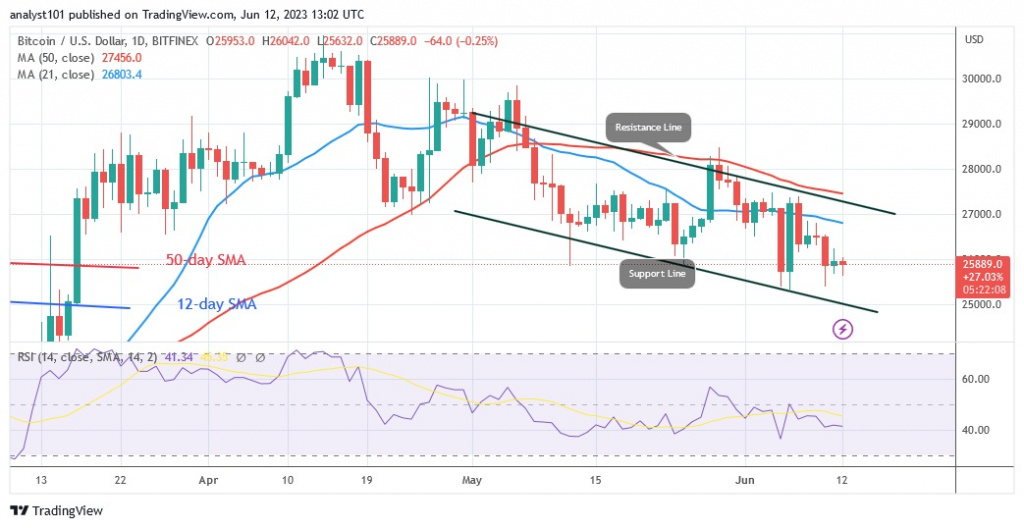
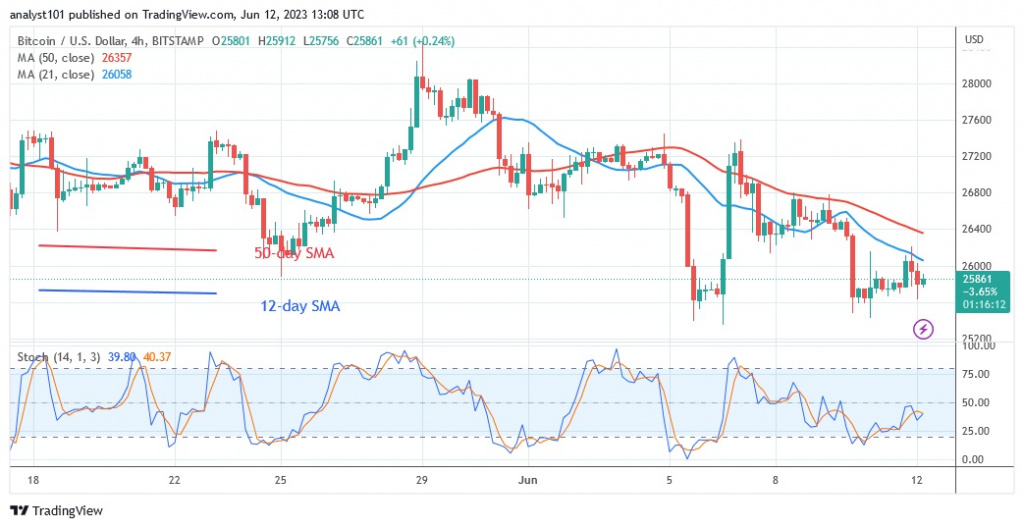
On June 5, the bearish momentum ended the rise that had been between $26,000 and $28,000. The collapse dropped the cryptocurrency to a low of $25,391. Currently, the price of one bitcoin is at $25,865. Meanwhile, the resistance at $27,000 or the moving average lines are hindering the upward movement. If these resistances are broken, the bitcoin price will resume its positive trend. However, if the bears break the current resistance at $25,000, the largest cryptocurrency will face further losses. The BTC price is currently oscillating between the support at $25,000 and the resistance at $27,000.
Bitcoin indicator display
In the Relative Strength Index, Bitcoin has risen to the value of 41 in the period 14. The value of the cryptocurrency is in a bearish trend zone and may continue to fall. The distance of the price bars from the moving average lines is the cause of the current decline. The bullish energy has dropped below the daily stochastic value of 50.
Technical Indicators:
Key resistance levels – $30,000 and $35,000
Key support levels – $20,000 and $15,000
What is the next direction for BTC/USD?
Bitcoin is above the $25,000 support despite its recent decline. According to the RSI, Bitcoin is in a downtrend area and could fall further. On June 6, when the bulls were trying to keep the price above the $27,000 resistance, Bitcoin came under more selling pressure. After the price retraced above $25,000, Bitcoin is currently trading lightly.
Disclaimer. This analysis and forecast are the personal opinions of the author and are not a recommendation to buy or sell cryptocurrency and should not be viewed as an endorsement by CoinIdol. Readers should do their research before investing in funds.
Source: Read Full Article


