Bitcoin (BTC) is in a downtrend but has made an upward correction to its previous high.
Bitcoin price long term forecast: bearish
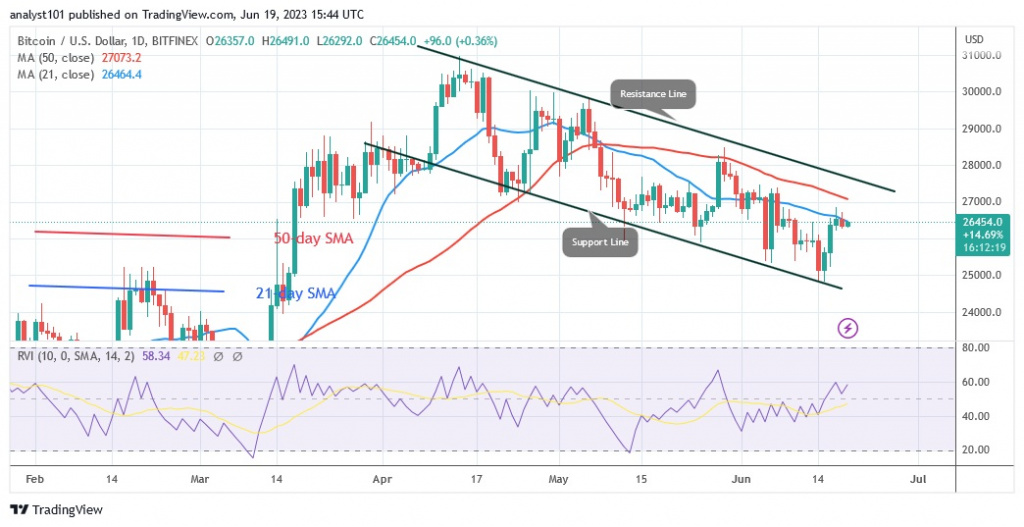
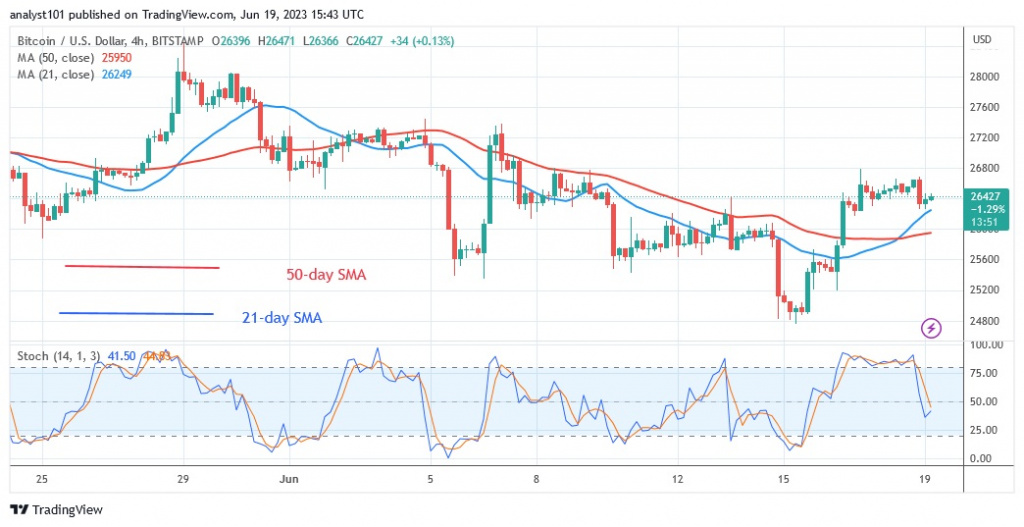
BTC reached a high of $26,800 on June 17, but failed to sustain upward momentum. At the recent high, the largest cryptocurrency is encountering resistance. The recent high represents an overbought area of the market. On the plus side, a rally above the moving average lines is possible if buyers break the recent high. Bitcoin will trade above the $28,000 support level. Meanwhile, the bitcoin price will fall if the previous high is rejected. Bitcoin price will fall to the previous low of $25,391 or $24,838. Meanwhile, the BTC price is fluctuating below the resistance level of $26,800.
Bitcoin indicator display
Bitcoin price is rising because it is in the uptrend zone, but it is still below the moving average lines. The price bars are held back by the moving average lines. As long as the price bars are below the moving average lines, Bitcoin will fall. For the period 14, the cryptocurrency asset is at the Relative Strength Index level 58. Bitcoin resumes its bullish momentum above the daily stochastic level of 40.
Technical Indicators:
Key resistance levels – $30,000 and $35,000
Key support levels – $20,000 and $15,000
What is the next direction for BTC/USD?
Bitcoin has risen above $26,000 support during the recent uptrend, but the uptrend was short-lived. The cryptocurrency is now trading above the current support level. At the recent high, buyers are struggling to break through support. There is a risk that bitcoin will fall if it is rejected at its recent high.
Disclaimer. This analysis and forecast are the personal opinions of the author and are not a recommendation to buy or sell cryptocurrency and should not be viewed as an endorsement by CoinIdol. Readers should do their research before investing in funds.
Source: Read Full Article


