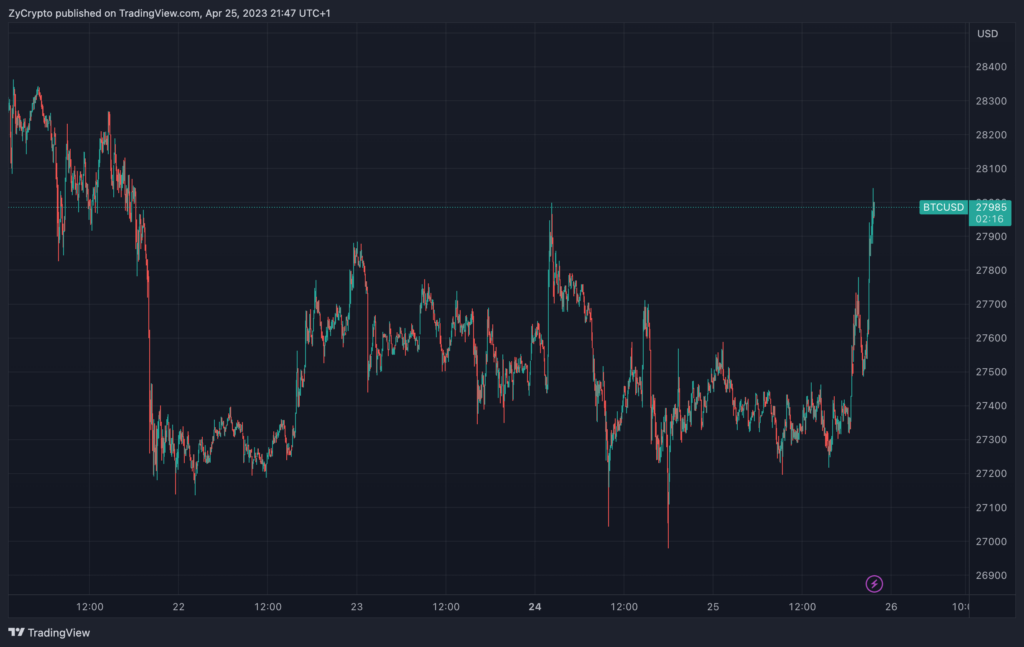
Bitcoin has continued to come under pressure, tagging along with Ether and other cryptocurrencies amid regulatory concerns for the crypto sector and profit-taking activities.
At press time, Bitcoin was trading at $27,978, down 8.06% since it tapped a ten-month high of $31,000 on April 14. On the other hand, Ether was exchanging hands at $1,859, down just over 13% in the past week, with most altcoins being hammered a little bit more.
Meanwhile, Bitcoin’s gradual decline has led some analysts to focus on cues to help foretell its next possible move.
According to Brian Q, senior market analyst at Santiment, investors should look out for Bitcoin’s utility metric even as the cryptocurrency gets torn between revisiting $30,000 or $25,000. In his view, “without a rising number of coins moving from address to address, and without a rising number of addresses interacting with those rising coins, most price rallies are historically short-lived.”
He further noted that bull traps often occur when prices rise quickly but utility lags, a scenario that arose in the first quarter of 2023.
“Traders become FOMO’ers and buy into the inflating market caps, and then get blindsided when the rally comes to a quick halt shortly after they bought. We can see that this occurred with the 3-month pump at the beginning of 2023,” he added.
On that note, Brian highlighted three more metrics traders should watch out for in determining Bitcoin’s utility. According to him, traders should closely monitor trading volume, daily active addresses, and circulation. While these metrics have not been impressive recently, he emphasised that on-chain utility conditions need to improve for the cryptocurrency’s price to recover.
Despite utility metrics displaying lacklustre behaviour, other vital metrics such as whale activity and the market-value-to-realized-value (MVRV) have been surging, suggesting increasing interest in Bitcoin.
Today, crypto analyst Hoss shared a chart by Glassnode showing that whales with more than 10,000 BTC have been accumulating rapidly while smaller addresses are selling.
On the other hand, the MVRV, an indicator that has historically proven excellent at detecting major tops or bottoms, has recently tapped an 11-month high. This observation was made today by Gaah, an analyst for Santiment who expressed hope for its continued rise.
“There is still room to continue the Bitcoin price recovery, causing MVRV to reach the yellow line (intermediate region – trend transition phase) around 2.10,” he wrote.
“By projecting the market behaviour of the last bear market in 2018, the Bitcoin price later this year 2023 has great chances to reach $45,000 and build a bullish structure transitioning between the bear market to a new bull market,” he went on, adding that “the probability of new highs in 2023 is still there.”
Source: Read Full Article

